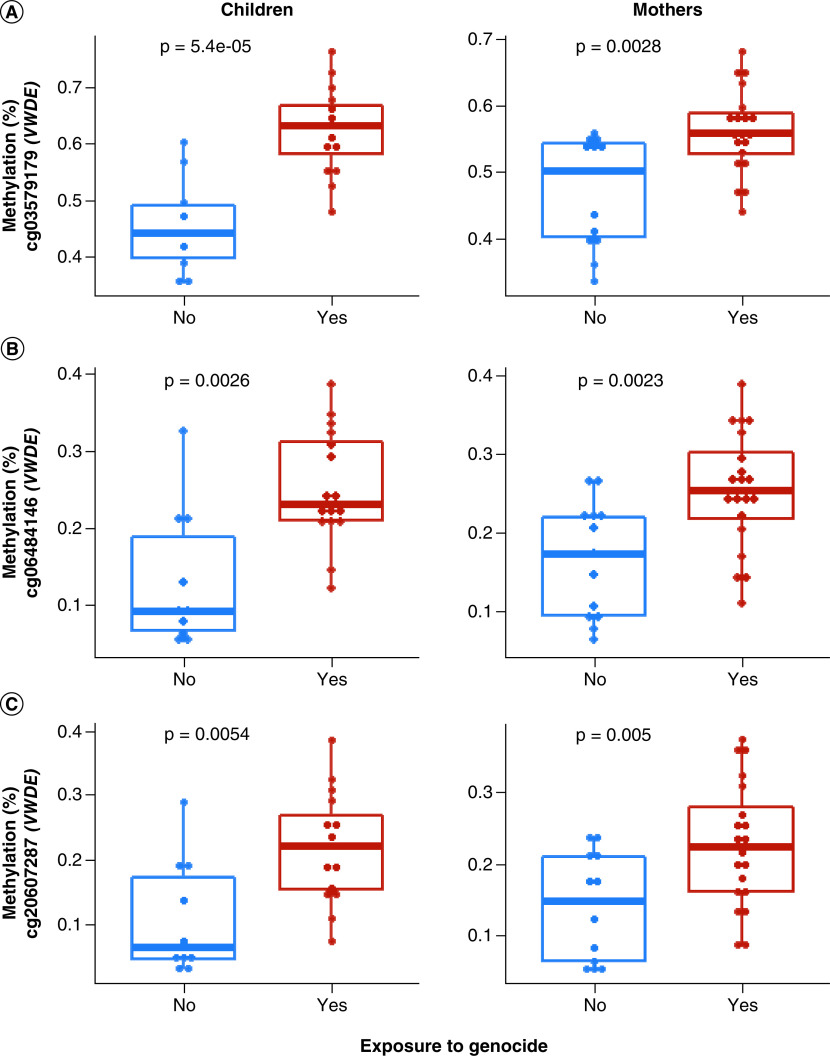
Figure 4. . t-test comparison of methylation (%) means between genocide-exposed versus unexposed children and mothers, respectively.
Blue represents lower mean methylation in unexposed individuals, and red represents higher mean methylation in exposed individuals. Each dot represents an individual sample. Methylation (%) of significant CpGs in VWDE is shown. All three-top enriched CpGs (cg03579179, cg06484146, cg20607287) showed higher methylation levels in those exposed to genocide at p < 0.05.

