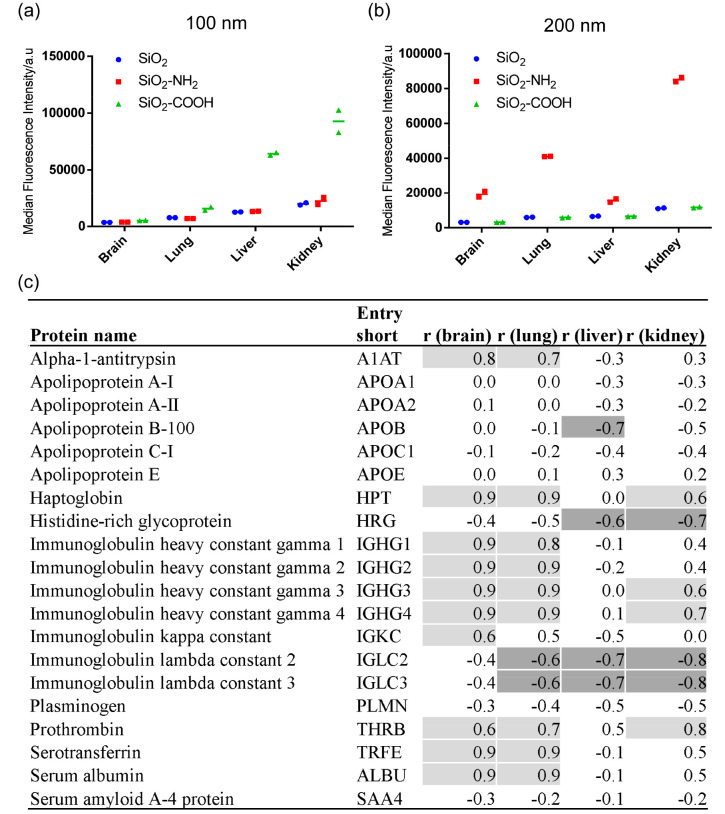
Figure 3.
Correlation between nanoparticle uptake in brain, lung, liver, and kidney endothelium after 5h exposure and the relative protein abundance of adsorbed corona proteins for all six silica nanoparticles tested. The uptake level of the nanoparticle-corona complexes formed on 100 (a) and 200 nm (b) silica nanoparticles in full human serum after 5 h. The results show the median cell fluorescence intensity of two replicate samples, together with their average indicated with a line. (c) Corona proteins correlating with uptake. The table shows the results of the correlation analysis between the 5-h nanoparticle uptake in brain, lung, liver, and kidney endothelium and the relative protein abundance of adsorbed corona proteins, performed as described in the Materials and Methods section. Positive correlation coefficients (r) ≥ 0.6 are shaded in light gray, and negative correlation coefficients (r) ≤ 0.6 are shaded in dark gray.

