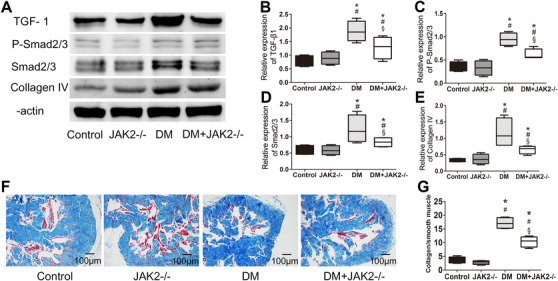
FIGURE 6.

Fibrosis in corpus cavernosum. (A) Representative western blot results for TGF‐β1, phosphorylated Smad2/3, Smad2/3, and Collagen IV. (B–E) Relative expression of TGF‐β1, phosphorylated Smad2/3, Smad2/3, and Collagen IV compared with β‐actin detected with western blot; data are shown as the fold changes over the control group; n = 4 for each group. (F) Representative images of Masson's trichrome staining (200×); smooth muscle was stained red and collagen was blue. (G) Ratio of collagen to smooth muscle detected with Masson's trichrome staining; n = 4 for each group. *: p < 0.05 compared with control group. #: p < 0.05 compared with JAK2−/− group. §: p < 0.05 compared with DM group. DM: diabetes mellitus. TGF‐β1: transforming growth factor beta 1
