Figure 2.
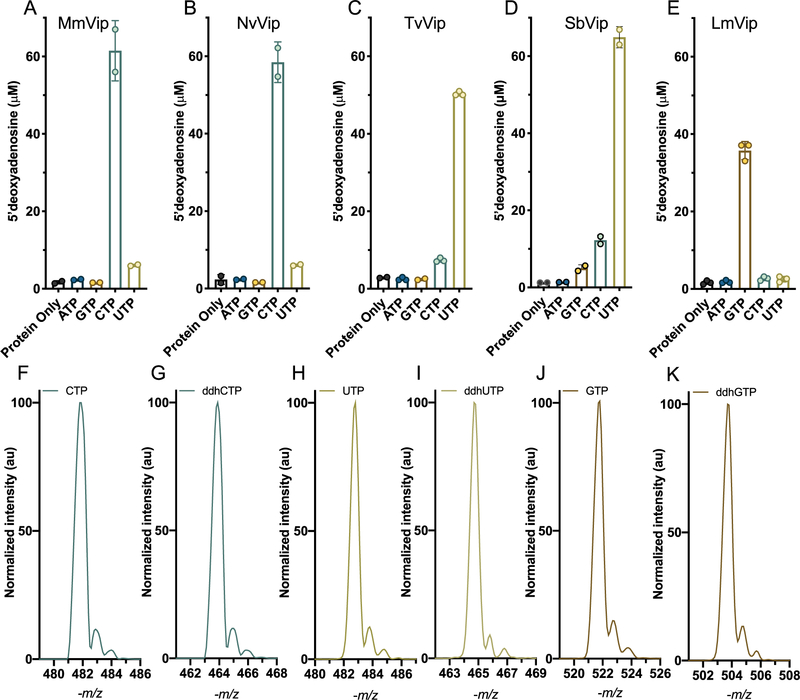
Determination of nucleotide preference and mass spectra of NTP and ddhNTP products. Each viperin homologue at 50 μM (MmVip, A; NvVip, B; TvVip, C; SbVip, D; LmVip, E) was separately mixed with 1 mM NTP, 5 mM dithionite, and 2 mM SAM and reacted for 5 min at room temperature. 5′-dA production is plotted for each nucleotide. ESI– mass spectra of (F) CTP and (G) the corresponding product of NvVip, and MmVip, ddhCTP. ESI– mass spectra of (H) UTP and (I) the corresponding product of TvVip and SbVip, ddhUTP. ESI– mass spectra of (J) GTP and (K) the corresponding product of LmVip, ddhGTP. N = 2 for MmVip, NvVip, and SbVip, and N = 3 for TvVip and LmVip.

