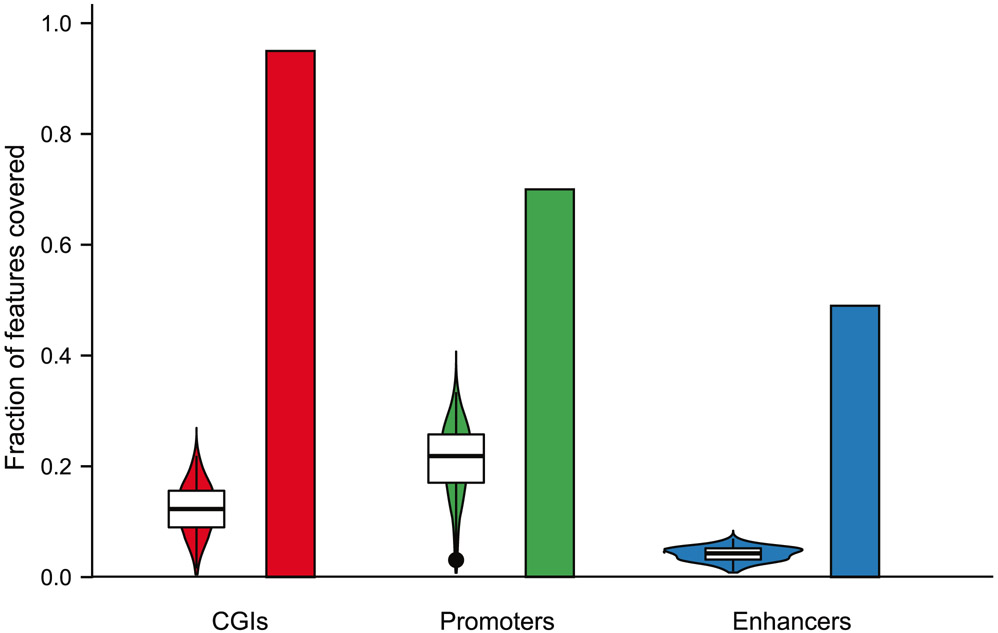
Extended Data Fig. 6 ∣. Fraction of all annotated CpG islands, promoters and enhancers covered at three or more CpGs.
Violin box plots show the distribution of the fraction of all annotated CGIs, promoters of protein-coding genes and permissive FANTOM5 enhancers in the human genome with RRBS coverage at three or more CpGs at the single-cell level. Bars indicate the fraction of these genomic features covered by RRBS reads aggregated from all 80 passing single cells.

