
Extended Data Fig. 1 ∣. Schematic of steps involved in the workflow of the RRBS data analysis.
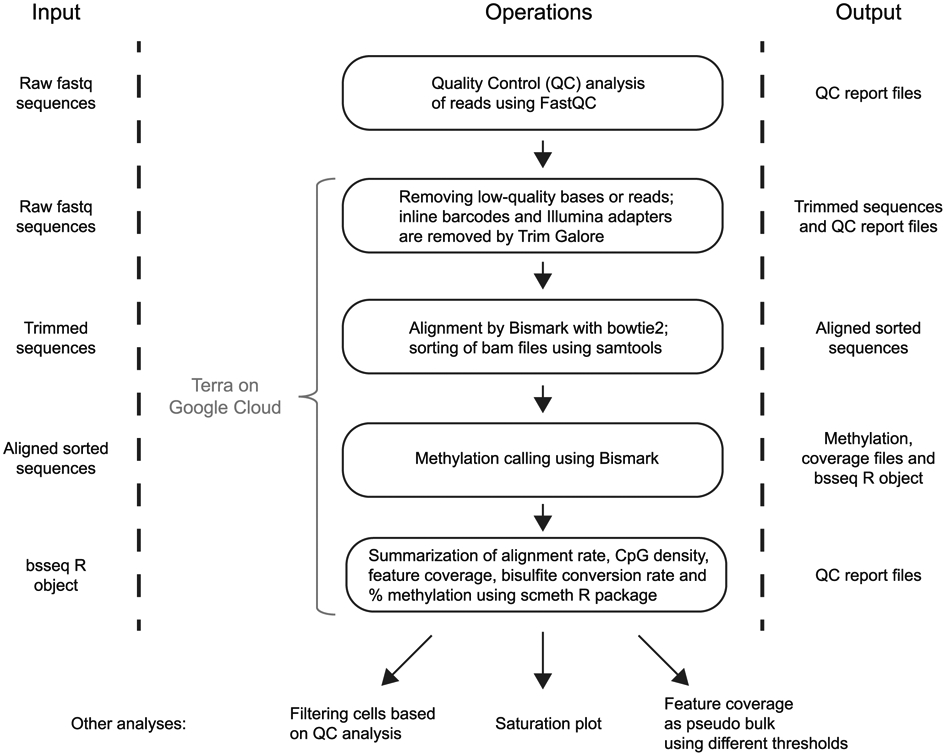
The figure is divided into three sections. In the operations section, each box contains a description of the data analysis step, and arrows indicate the progression through the analysis workflow. First, the user can easily run the FastQC analysis, which provides basic sequencing quality metrics, base composition and Illumina-adapter content. The rest of the workflow is developed in the Workflow Description Language format and is available on Terra, a cloud-native platform that runs in the Google cloud. Each row shows the input files that are required for each operation and the format of result reports or files that will be obtained. The last analysis steps (quality-filtering of cells, saturation plot and pseudo bulk analysis) have been described in the main text.