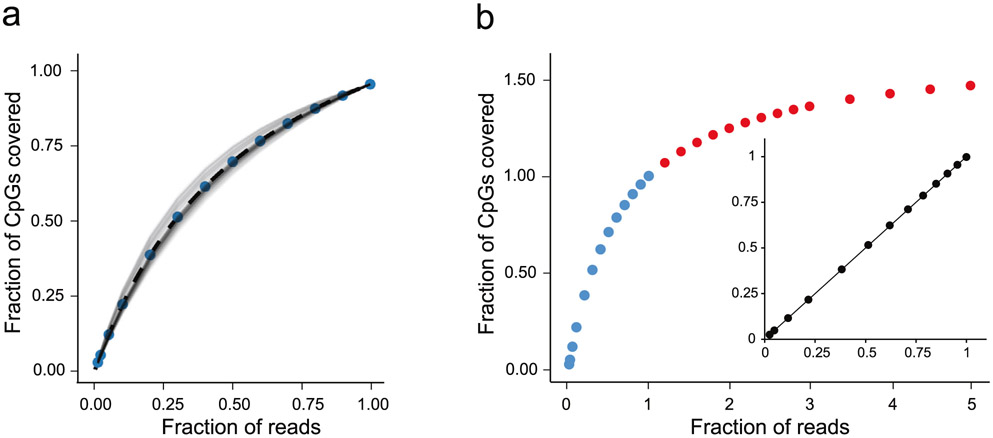
Extended Data Fig. 5 ∣. Down-sampling and extrapolation of RRBS effort and CpG coverage.
a, The aggregate set of passing RRBS read pairs from 80 single cells was randomly down-sampled in steps from the full data (1 on the x-axis; 1.72 billion total read pairs; mean: 2.15 million per cell) to 0.01. The number of CpGs covered in each cell at each step was determined, and the corresponding saturation curves were normalized by the CpGs covered at the original full sequencing effort, interpolated and plotted as a function of the relative sequencing effort (fraction of reads). The blue dots represent the mean normalized fraction of CpGs at each step. b, The blue dots in the saturation curve are the same down-sampled data points as in a. The insert is a linear regression (R2 = 0.99999) of the actual mean normalized CpGs (blue dots) versus calculated mean normalized CpGs, assuming the saturation curve follows a Michaelis-Menten equation: (Fraction of CpGs)calc = (Fraction of reads/0.6004)/(Fraction of reads + 0.4023/0.6004), whereby 0.6004 and 0.4023 were the slope and y-intercept, respectively, of a Hanes-Woolf linearization of the Michaelis-Menten equation (R2 = 0.9999). The red dots are extrapolated mean normalized fractions of RRBS-covered CpGs. The saturation curve approaches a limit of ~1.67 on the y-axis, corresponding to a mean of 2.3 million CpGs per cell. Extrapolation to 5 on the x-axis results in 2.0 million CpGs per cell on average.

