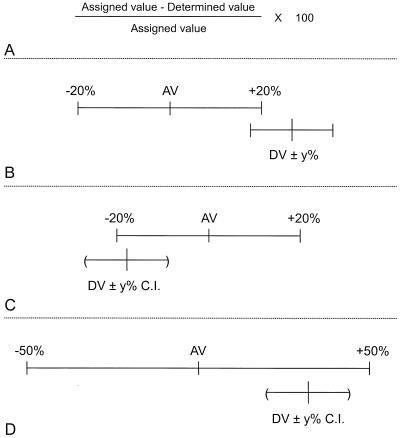
FIG. 1.
Schematic diagrams of four methods used to determine the magnitude of agreement between laboratory-determined values (DV) and values assigned to the sera (AV). (A) Percent error; (B) intersecting ranges; (C) intersecting range and confidence interval (C.I.); (D) overlapping range and confidence interval. See text for explanation.

