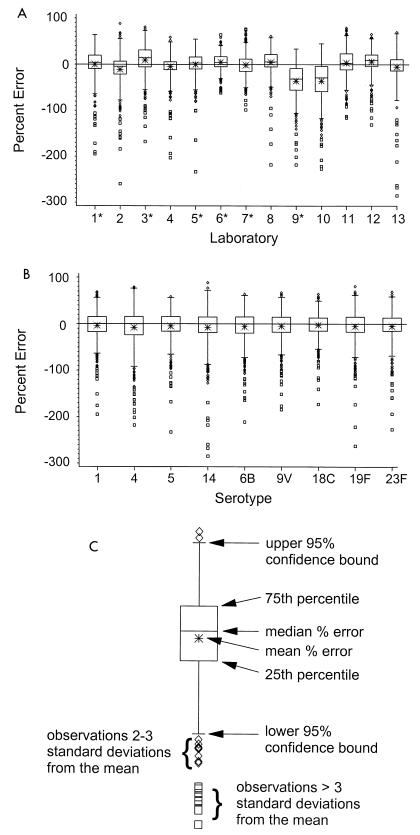
FIG. 3.
(A) Distribution of percent errors stratified by laboratory. One laboratory evaluated the series twice. The number of assay determinations from each laboratory is 432. Laboratories denoted with an asterisk submitted three or more assay determinations for each serum sample. These values were averaged prior to generation of the box plots. (B) Percent error distributions stratified by serotype. The number of assay determinations for each serotype is 624. (C) Diagram of the individual components of the box plots.

