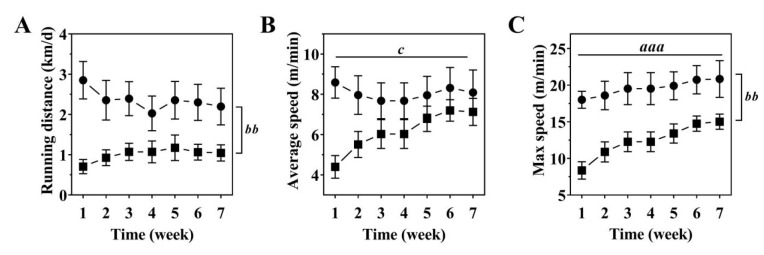
Figure 1.
Running distance (A), average (B) and maximal running speeds (C) of WT (black circle) and OI mice (black square) over a seven-week voluntary wheel running period. Data represent mean ± SEM. n=8-9/group. Significant effects were analyzed using one-way ANOVA (A) and two-way ANOVA (B, C) for repeated measures followed by Bonferroni post-hoc test: Effect of Time: aaap<0.001; Effect of Genotype: bbp<0.01; Time x Genotype interaction: c<0.05.

