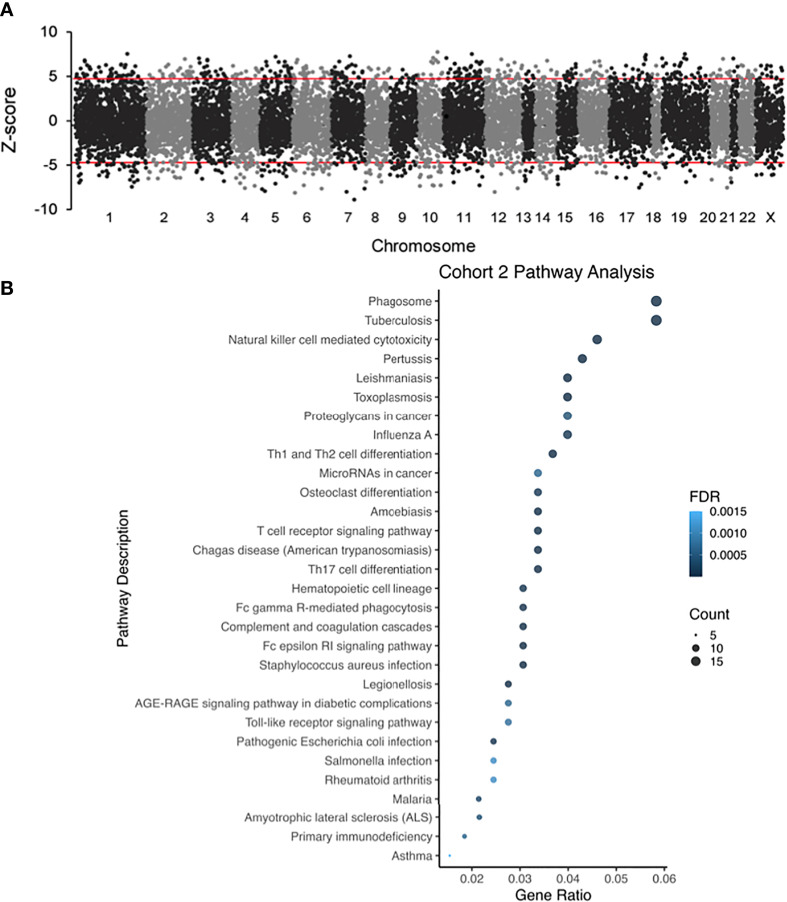
Figure 3.
(A) Different glomerular microarray platforms in GEO were converted to Entrez Gene identifiers and analyzed by eGWAS (Cohort 2). Using a one-tailed T-test P values between DKD and controls were calculated, which were converted to Z-scores and meta-analysis was performed based on the weighted Z-method. Gene expression leading to a Z-score above 5 or below -5 was considered significantly up or downregulated. (B) Dot-plot showing the top pathways in cohort 2.

