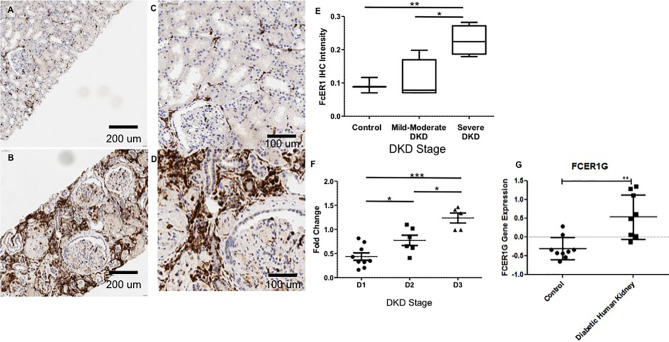
Figure 5.
Representative Immunohistochemistry staining for FcER1 in human kidney tissue. (A) Normal kidney at 20x. (B) Diabetic kidney at 20x. (C) Normal kidney at 40x. (D) Diabetic kidney at 40x. (E) The intensity of FcER1 staining in human kidney tissue. (F) Gene expression of FcER1 from PBMCs at different stages of diabetic kidney disease. (G) Gene expression of FcER1 in control and diabetic kidney disease; *p < 0.05, **p < 0.01, ***p < 0.001; DKD, diabetic kidney disease; D1, diabetes with normoalbuminuria; D2, diabetes with microalbuminuria; D3, diabetes with macroalbuminuria.

