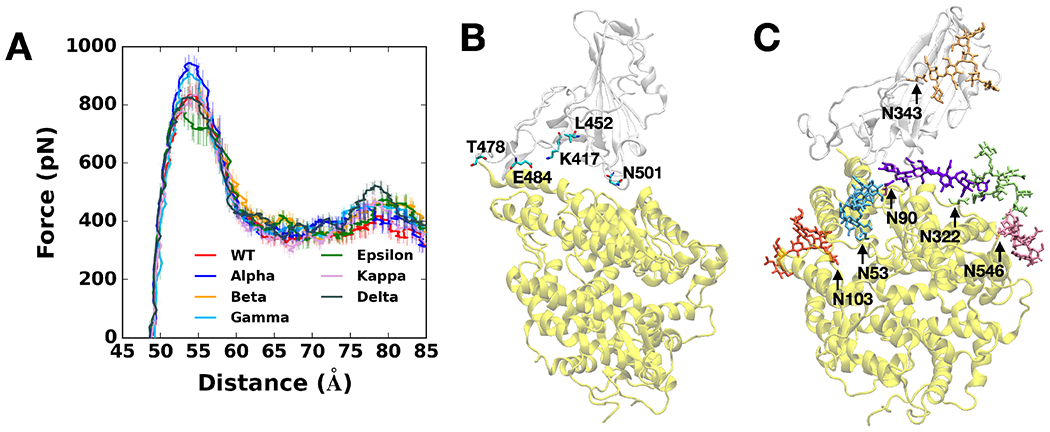
Figure 1.

(A) Average force profiles of WT (red), Alpha (blue), Beta (orange), Gamma (sky blue), Epsilon (green), Kappa (pink), and Delta (gray) variants as a function of the distance between the centers of mass of RBD and ACE2. (B) Initial snapshot of WT. Residues subjected to each mutation are shown as solid sticks (N501, K417, E484, L452, and T478). RBD and ACE2 are respectively colored in light gray and yellow. All N-glycans, water, and ions are hidden for clarity. (C) Initial snapshot of WT with clockwise 90° rotation along the normal from (B). All N-glycans are depicted in different colors. Any other residues, water, and ions are not shown for clarity.
