FIGURE 7.
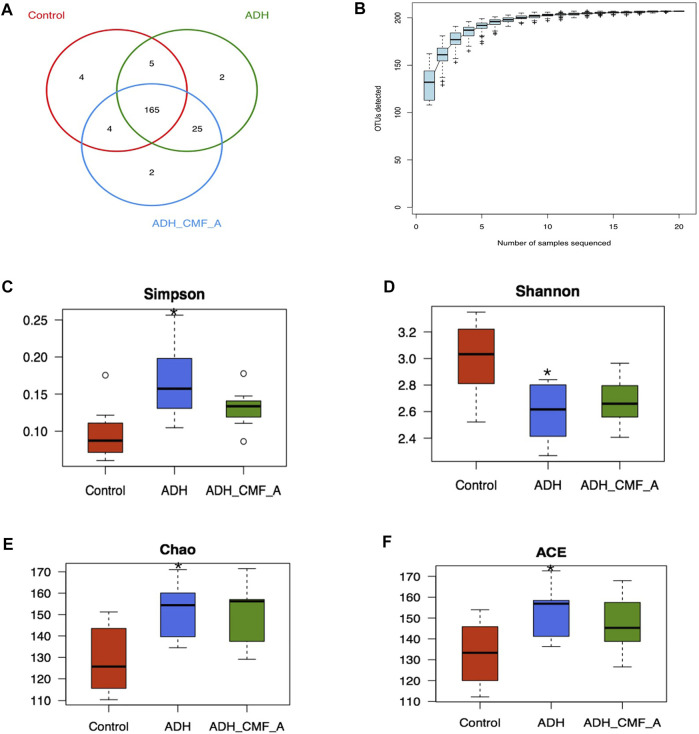
Effects of CMF on the structure and diversity of intestinal microflora (A) Venn diagram of OTU distribution differences between groups; (B) Species accumulation curve; (C) Comparison box of Simpson index for diversity; (D) Comparison box of diversity Shannon index; (E) Box chart of diversity Chao index comparison; (F) Box plot of diversity ACE index comparison; Compared with Control mice, *p < 0.05.

