Figure 2.

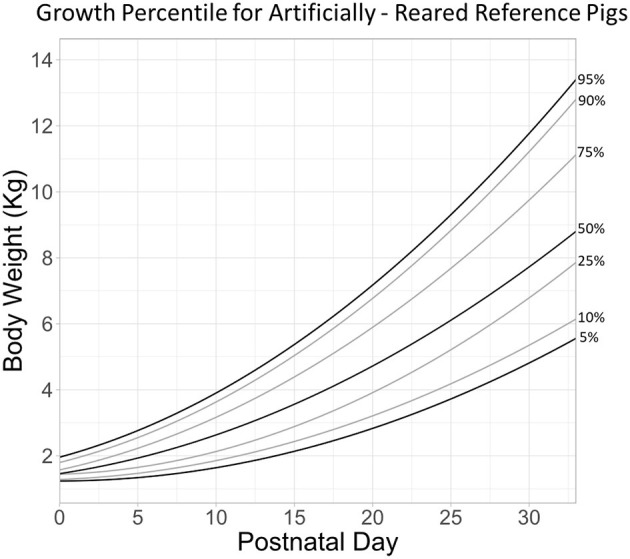
Growth percentile chart for artificially reared reference pigs is plotted as body weight as a function of postnatal day. Lines are growth quantile fits corresponding to 0.05, 0.10, 0.25, 0.50, 0.75, 0.90, and 0.95 quantiles.

Growth percentile chart for artificially reared reference pigs is plotted as body weight as a function of postnatal day. Lines are growth quantile fits corresponding to 0.05, 0.10, 0.25, 0.50, 0.75, 0.90, and 0.95 quantiles.