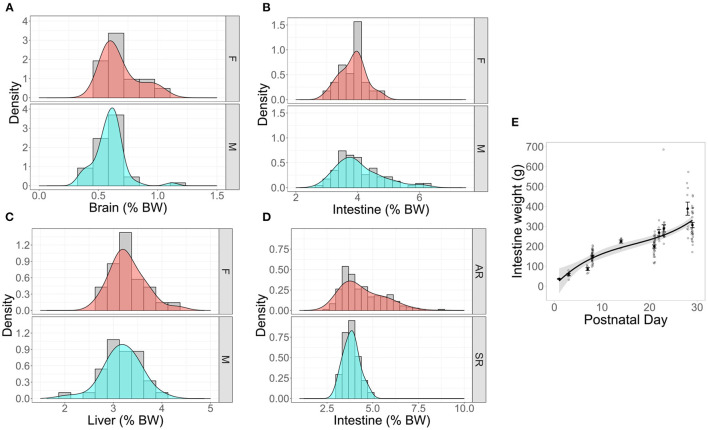
Figure 5.
Density plots with overlayed histograms showing smoothed distributions of organ weights of reference pigs stratified by (A–C) sex or (D) rearing environment. “Density” represents the function used to calculate the probability of getting a value between a range of values on the x-axis. The peaks of the density depict where values are concentrated over a given interval. The density plotted as percent of total body weight (BW) for (A) brain, nmale = 20, nfemale = 8, (B) intestines nmale = 60, nfemale = 15, and (C) liver nmale =8, nfemale = 8. (D) A density plot of percent intestinal growth in artifically-reared (AR) and sow-reared (SR) artificial reference pigs, nAR = 57, nSR =18. (E) Absolute intestinal weight plotted as a function of PND (PND 1, nsample = 3; PND 3, nsample = 7; PND 7, nsample = 6; PND 8, nsample = 34; PND 14, nsample = 6; PND 21, nsample = 31; PND 22, nsample = 7; PND 23, nsample = 21; PND 28, nsample = 11; PND 29, nsample = 31) in artificially-reared reference animals indicates linear increase over time.

