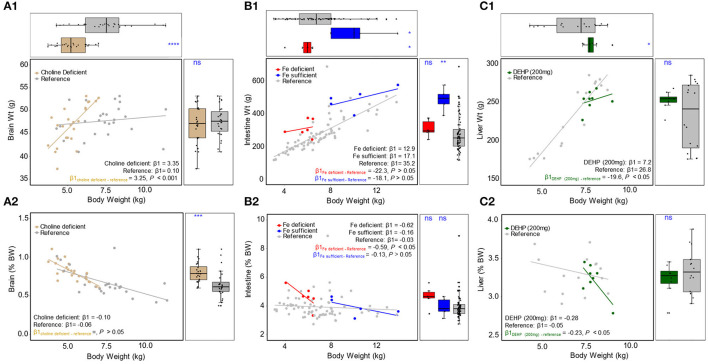
Figure 6.
Scatter plot with marginal boxplots of absolute (top) and relative (bottom) organ weights are plotted as a function of BW for (A1,2) brain, comparing choline deficient experimental pigs and typical reference pigs, (B1,2) intestine, comparing iron deficient, iron sufficient, and typical reference pigs, and (C1,2) liver, comparing DEHP (200 mg) and typical reference pigs. ns p > 0.05, *p ≤ 0.05, **p ≤ 0.01, ***p ≤ 0.001, ****p ≤ 0.0001.

