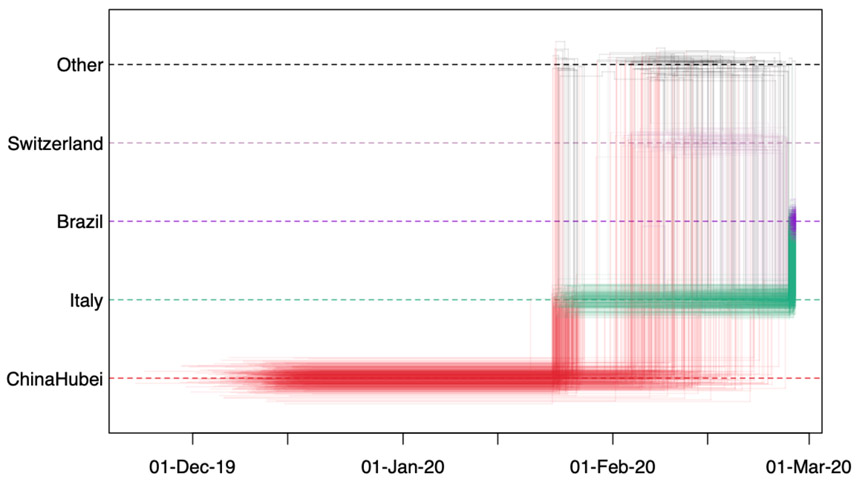
Figure 6:
Spatial trajectory plot of isolate EPI_ISL_413016. The plot depicts the posterior spatiotemporal ancestral transition history for a single isolate. Each line represents a single Markov jump history in the posterior distribution. The time spent in each location is denoted in the horizontal dimension, and transitions between two locations are depicted with vertical lines. The relative density of lines reflects the posterior uncertainty in location state and transition time between states. Here we see that the most supported ancestral history for isolate EPI_ISL_413016 is that of an origin in Hubei, with a jump into Italy late January, and an introduction into Brazil close to March 1st.

