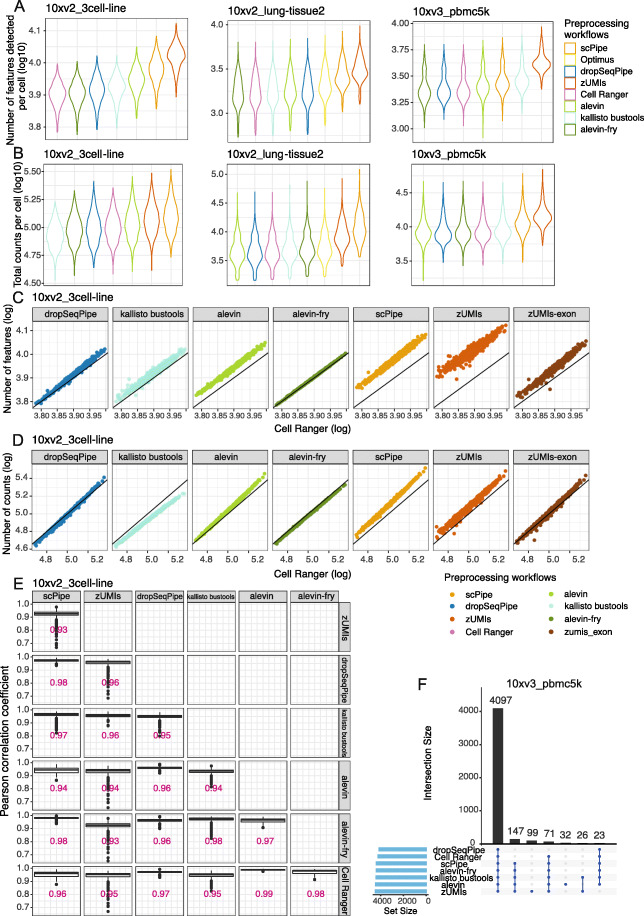
Fig. 4.
Comparing gene expression quantification of different scRNA-seq preprocessing workflows on droplet-based datasets. A The number of detected genes per cell and B total counts per cell (both on a log10-scale) on the 10xv2_3cell-line, 10xv2_lung-tissue2, and 10xv3_pbmc5k datasets. C The number of detected genes per cell and D total counts per cell for common cells for different preprocessing workflows against Cell Ranger on the 10xv2_3cell-line dataset. The identity line (y=x) is plotted in black in each panel. E The Pearson correlation coefficients between the gene counts of different pairs of preprocessing workflows for the 10xv2_3cell-line dataset. Median values of the correlation coefficients are labelled. F An UpSet plot displays the overlap of retained cells across workflows on the 10xv3_pbmc5k dataset

