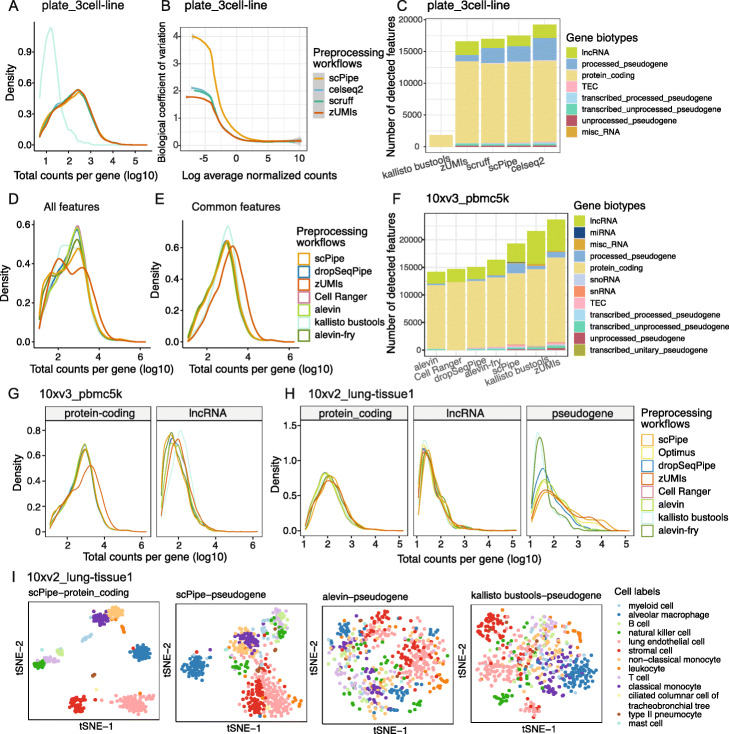
Fig. 5.
Comparing gene biotype detection of different scRNA-seq preprocessing workflows. A Density of total counts per gene (on a log10-scale), B biological coefficient of variation (BCV) for each feature versus gene abundance, and C the number of detected features per gene biotype for different workflows for the plate_3cell-line dataset. D The density of total counts per gene of all features, E common features (both on a log10-scale), F the number of detected features per gene biotype, and G the density of total counts (log10-scale) for distinct gene biotypes (protein coding genes and lncRNAs) for different workflows on the 10xv3_pbmc5k dataset. H Density plot for distinct gene biotypes (protein coding genes, lncRNAs and pseudogenes) for different workflows on the 10xv2_lung-tissue1 dataset. I tSNE plots generated with protein coding genes and pseudogenes using scran normalized counts for the 10xv2_lung-tissue1 dataset. Colors represent different cell type labels

