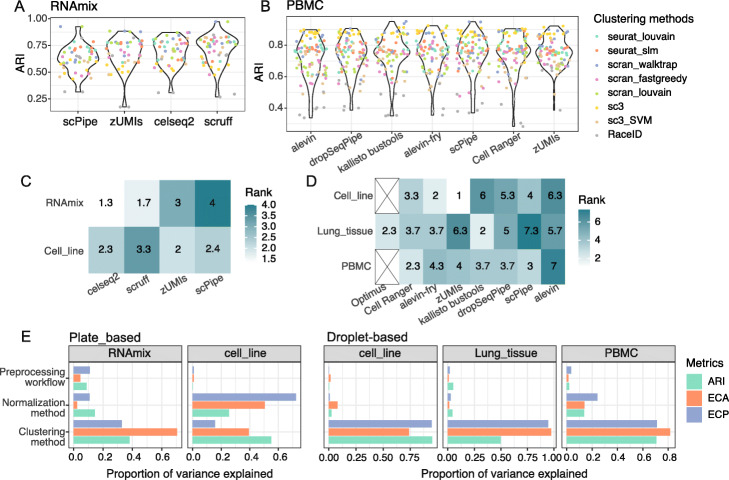
Fig. 7.
Comparing performance of different preprocessing, normalization, and clustering methods. A Violin plots of ARI for different preprocessing workflows on plate-based RNAmix dataset and B droplet-based PBMC datasets. Each point represents a method combination and is colored by the clustering method applied. C The preprocessing workflows’ influence on clustering results is summarized for plate-based data and D droplet-based data. Colors represent the rank of their average rank across evaluation metrics (ARI, ECA, ECP). Lighter color means better performance (i.e. higher rank). E Proportion of variance in ARI, ECA and ECP explained by the 3 major components of the analysis pipeline examined for plate-based (left) and droplet-based (right) datasets. Colors denote different performance metrics (ARI, ECA, and ECP) used as input to the ANOVA model (performance metric ∼preprocessing+normalization+clustering+experimental design)

