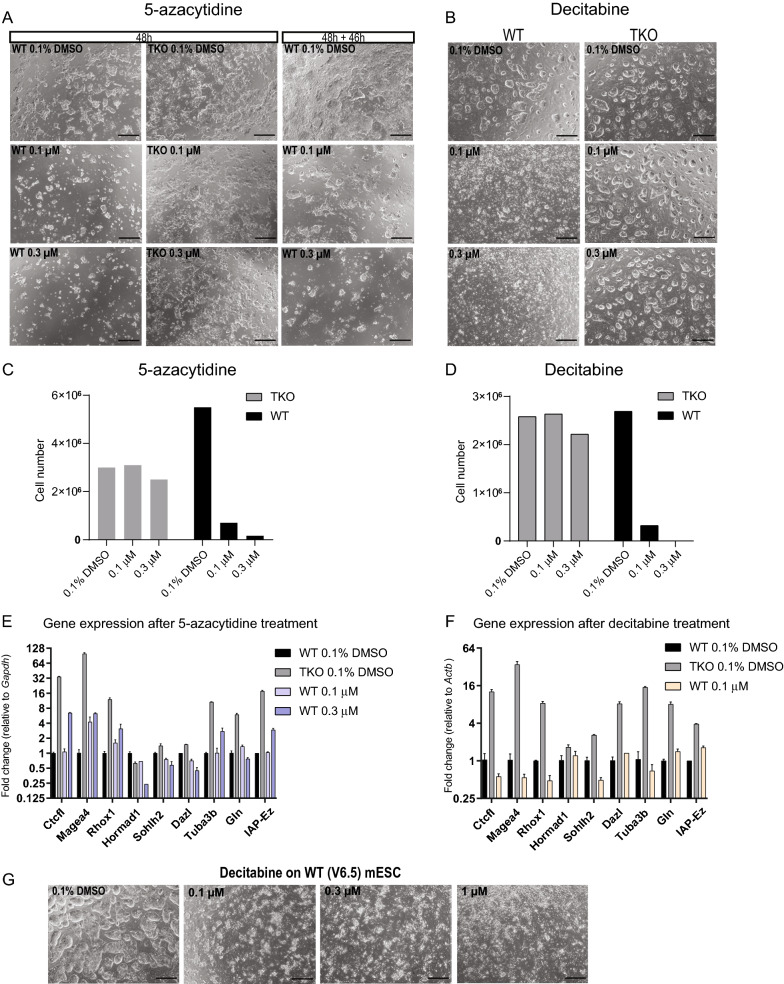
Fig. 3.
Treatment of mESCs with 5-azanucleosides. A Brightfield images of WT and Dnmt1/3a/3b TKO mESCs after 48 h of exposure to 0.1% DMSO, 0.1 µM or 0.3 µM 5-azacytidine (left columns) and WT cells 46 h after the end of treatment with 5-azacytidine (right column). Scale bar = 500 μm B Brightfield images taken of WT and TKO mESCs after 48 h of exposure to 0.1% DMSO, 0.1 or 0.3 µM decitabine. To enhance survival, these cells were cultured on murine embryonic feeders (MEFs) rather than gelatin, hence the distinct morphology. Scale bar = 500 μm C, D Cell numbers after treatment and recovery for 5-azacytidine (C) and decitabine (D). E, F Expression of methylated genes upon 5-azacytidine (E) or decitabine (F) treatment and recovery, normalized to Gapdh and Actb, respectively. Mean and standard error of two technical replicates are indicated. G V6.5 mESCs after exposure to decitabine. These cells showed similar lethality to J1 WT mESCs

