Fig. 4.
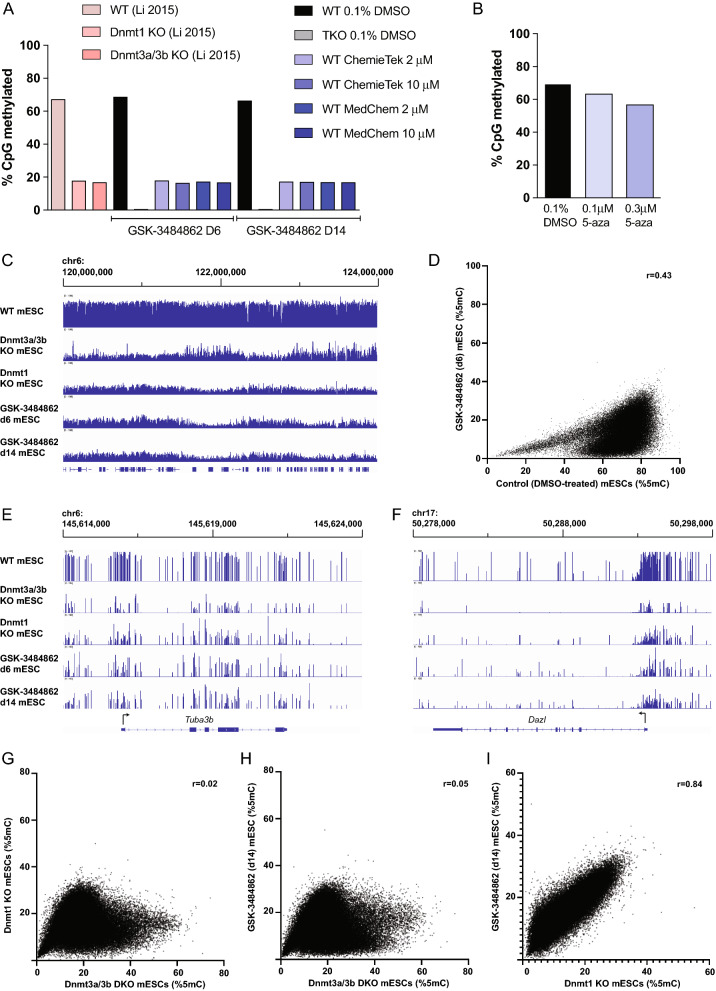
CpG methylation reduction after treatment with GSK-3484862 or 5-azacytidine. A Global CpG methylation levels of WT cells treated with 0.1% DMSO, Dnmt1/3a/3b TKO cells treated with 0.1% DMSO, and WT cells after six or 14 days of treatment with 2 µM or 10 µM GSK-3484862. Methylation levels of published Dnmt1−/− and Dnmt3a−/−3b−/− knockout cells are shown in comparison [31]. B Methylation levels in WT mESCs after treatment with 0.1% DMSO, 0.1 µM or 0.3 µM 5-azacytidine. C DNA methylation over a 4-MB region over chromosome 6 in samples indicated. The first three samples are from published data [31]. Height of bar indicates extent of CpG methylation in a region, from 0 to 100%. D DNA methylation level of 10 kb regions of the genome are indicated, with each region plotted as a single point. E, F DNA methylation level over the Tuba3b and Dazl genes. G, I DNA methylation level of 10 kb regions of the genome are plotted for the samples shown, with Pearson correlation coefficient indicated. The Dnmt1−/− and Dnmt3a−/−3b−/− data are from published data [31]

