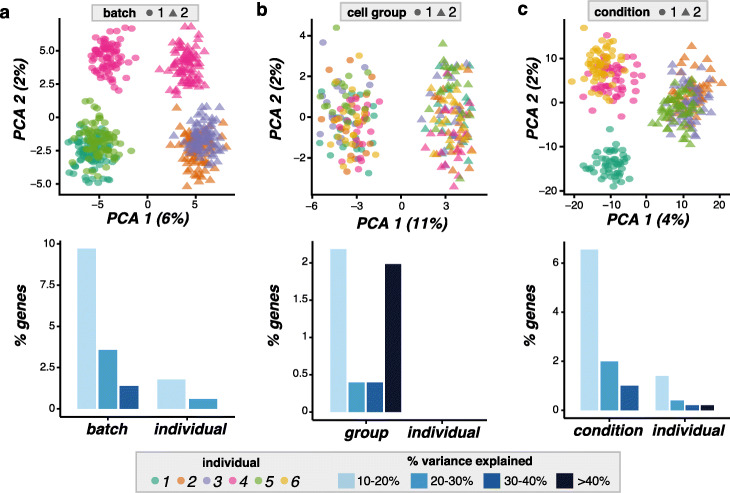
Fig. 3.
Examples of complex splatPop simulations. A principal component analysis (PCA; top) plot of the simulations with each individual designated by color and each complex effect denoted by shape and the distribution of the degree of variance in gene expression across cells explained by the experimental factor (bottom) for simulations with a batch effects using ss2-iPSC as a reference, b cell group effects using 10x-Neuro as a reference, and c conditional effects using 10x-IPF as a reference. Note, no variance in gene expression is explained by individual using the 10x-Neuro reference

