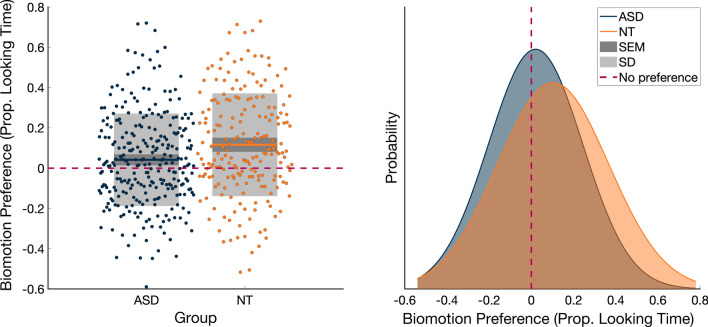
Fig. 1.
Top panel The main effect of diagnostic group on biological motion preference, Proportion Looking Time. A larger preference in the NT than the ASD group. Bottom panel The main effect of diagnostic group on biological motion preference, Peak Look Duration (PLD). A longer PLD to biological vs control motion in the NT than the ASD group. Left panels individual data, mean, SEM and SD; Right panels distribution of biological motion preference by diagnostic group, gaussian smoothed histogram. Dashed zero line represents no preference for biological or control motion

