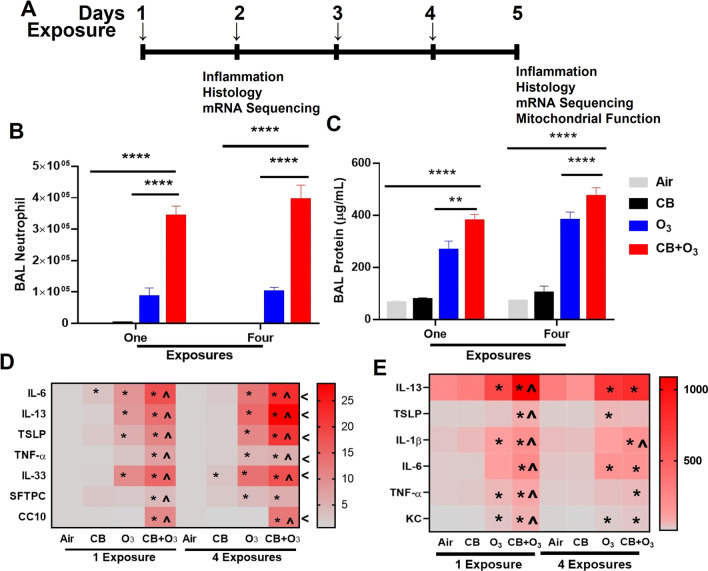
Fig. 3.
Exposure design and analysis of lung inflammation. A Layout of animal exposure experiments. B Number of polymorphonuclear leukocytes-neutrophils in bronchoalveolar lavage fluid. C Total protein quantification of bronchoalveolar lavage. D Real-time PCR analysis of mRNA expression (fold change) in lung homogenates, and E Bronchoalveolar lavage cytokine concentrations (pf/mL) by ELISA assay at 24 h post single and four exposures. Animals were exposed to air, CB (10 mg/m3), O3 (2 ppm), or CB + O3 for 3 h for either one time or four times (24 h apart) and euthanized 24 h post last exposure. Data are presented as the mean ± standard error of the mean (SEM) and analyzed by two-way Analysis of Variance (ANOVA) followed by Turkey’s post hoc test. There were n = 4–5 animals per group and per timepoint were used for these analyses. Where *P ≤ 0.05, **P ≤ 0.01, ***P ≤ 0.001, ****P ≤ 0.0001. PCR Analyses (panel D) *denotes significantly different from air/sham, ^ denotes significantly different from O3 at same time point, and < denotes significantly different between day one and four exposures

