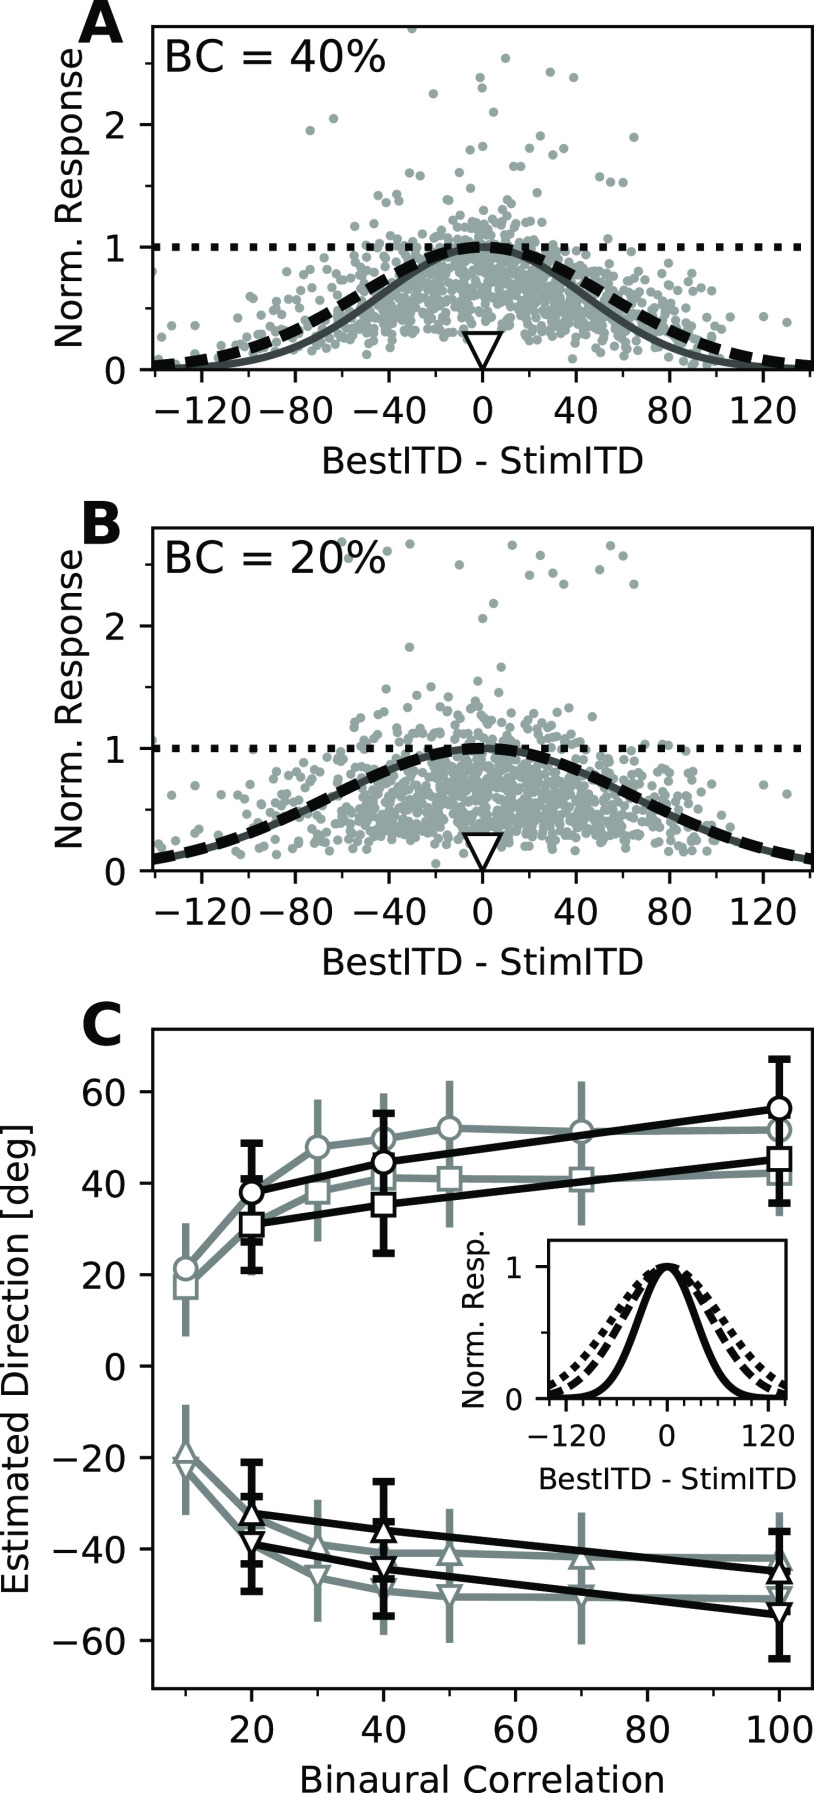
Figure 5.
Increased spread of activity for decorrelated stimuli. A, B, Normalized neural responses to stimuli with 40% (A) and 20% (B) BC (indicated in each panel), as a function of the best ITD of each unit, relative to the stimulus ITD. Responses were normalized to the maximal response of each unit in an ITD tuning curve with the same BC (dotted horizontal lines). Solid dark gray curves indicate the spread of activity presumed in the PV readout model (Fischer and Peña, 2011). The black dashed curves show the same functions with SDs that best fitted the data and that were used in the PV model-based decoder in this study. C, Direction estimates from the PV model (Fischer and Peña, 2011) using levels of SD from the original model (gray) and fitting a Gaussian function to population responses (black). Symbols indicate the stimulus directions (±55°, ±75°). Error bars indicate the SD across 500 model iterations. Inset, Comparison of the spreading widths (fitted SDs) of activity for 100% BC (solid), 40% BC (dashed), and 20% BC (dotted).

