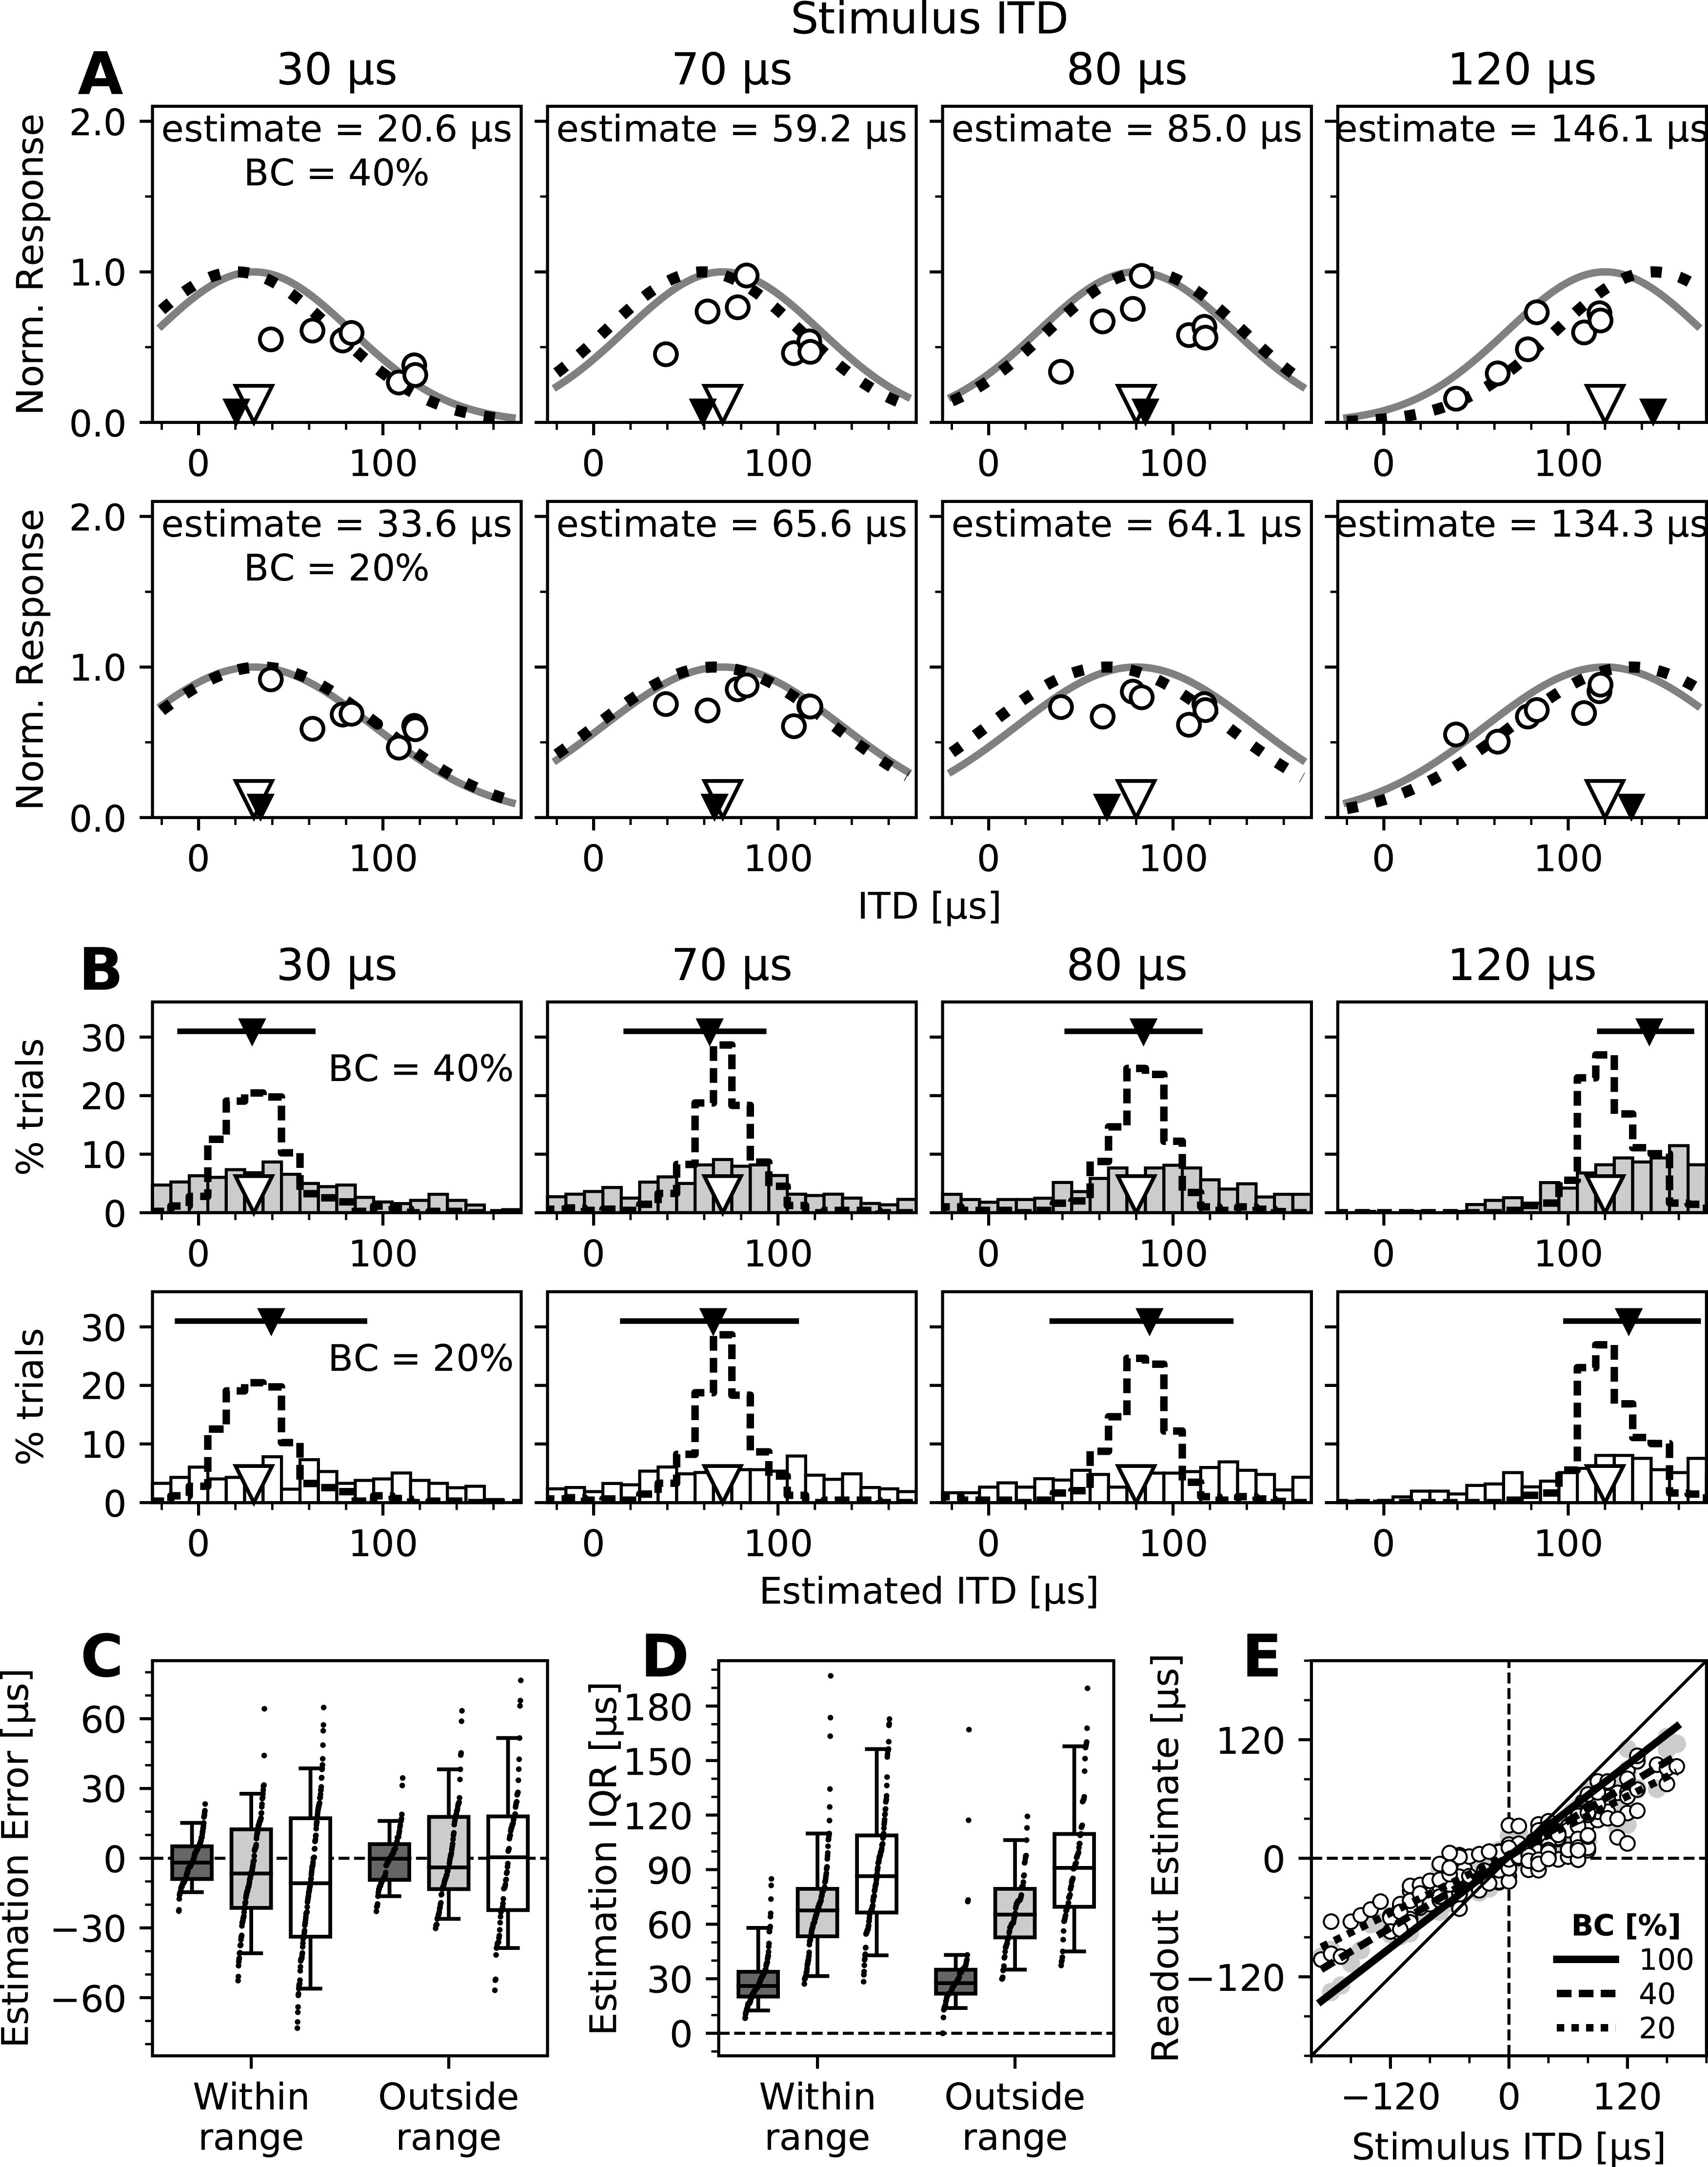
Figure 6.

Performance of the PV decoder across signal-to-noise levels. A, ITD decoding from normalized recorded responses (open circles) to stimuli of four different ITDs (indicated by open triangles and listed above each plot) and 40% (top row) and 20% (bottom row) BC as a function of the best ITDs of neurons. Black triangles indicate estimated ITDs. The same subset of neurons and decoding method shown in Figure 4B is presented. B, Estimation of stimulus ITDs on a trial-by-trial basis for stimuli of 40% (top row) and 20% (bottom row) BCs. Histograms of estimated ITDs from single-trial responses to four stimulus ITDs (same as in A). Dashed line histograms show results for stimuli of 100% BC (same as shown in Fig. 4C). C, Errors of trial-by-trial ITD estimates for all subsets of recorded neurons and stimuli, for stimuli at 100% BC (dark gray boxes; same data as in Fig. 4D), 40% BC (light gray boxes), and 20% BC (white boxes). Positive and negative error values indicate estimates that were more lateral and more frontal than the stimulus ITD, respectively. Boxes range from the 25th to the 75th percentile, and the horizontal line indicates the median. The bottom and top error bars indicate the 5th and 95th percentiles, respectively. Small black dots show all individual data. D, IQRs of the trial-by-trial estimates for all recorded subsets of neurons and stimuli, for stimuli of 100% BC (dark gray boxes), 40% BC (light gray boxes), and 20% BC (white boxes). Data are grouped as in C, and boxplots and markers have the same formatting. E, Estimates of the population readout based on trial-by-trial ITD estimates from population responses to stimuli of different BCs. Same as in Figure 4F, median ITD estimates of all subsets of recorded neurons were combined with the Bayesian prior and plotted as a function of stimulus ITD. Individual data are shown for stimuli of 40% BC (gray circles) and 20% BC (open white circles), and linear fits are shown for all three BC levels, as indicated in the legend. Larger deviation from the diagonal for stimuli of increased noise levels (bottom BCs) shows the increased frontal bias in the readout.
