Figure 1.

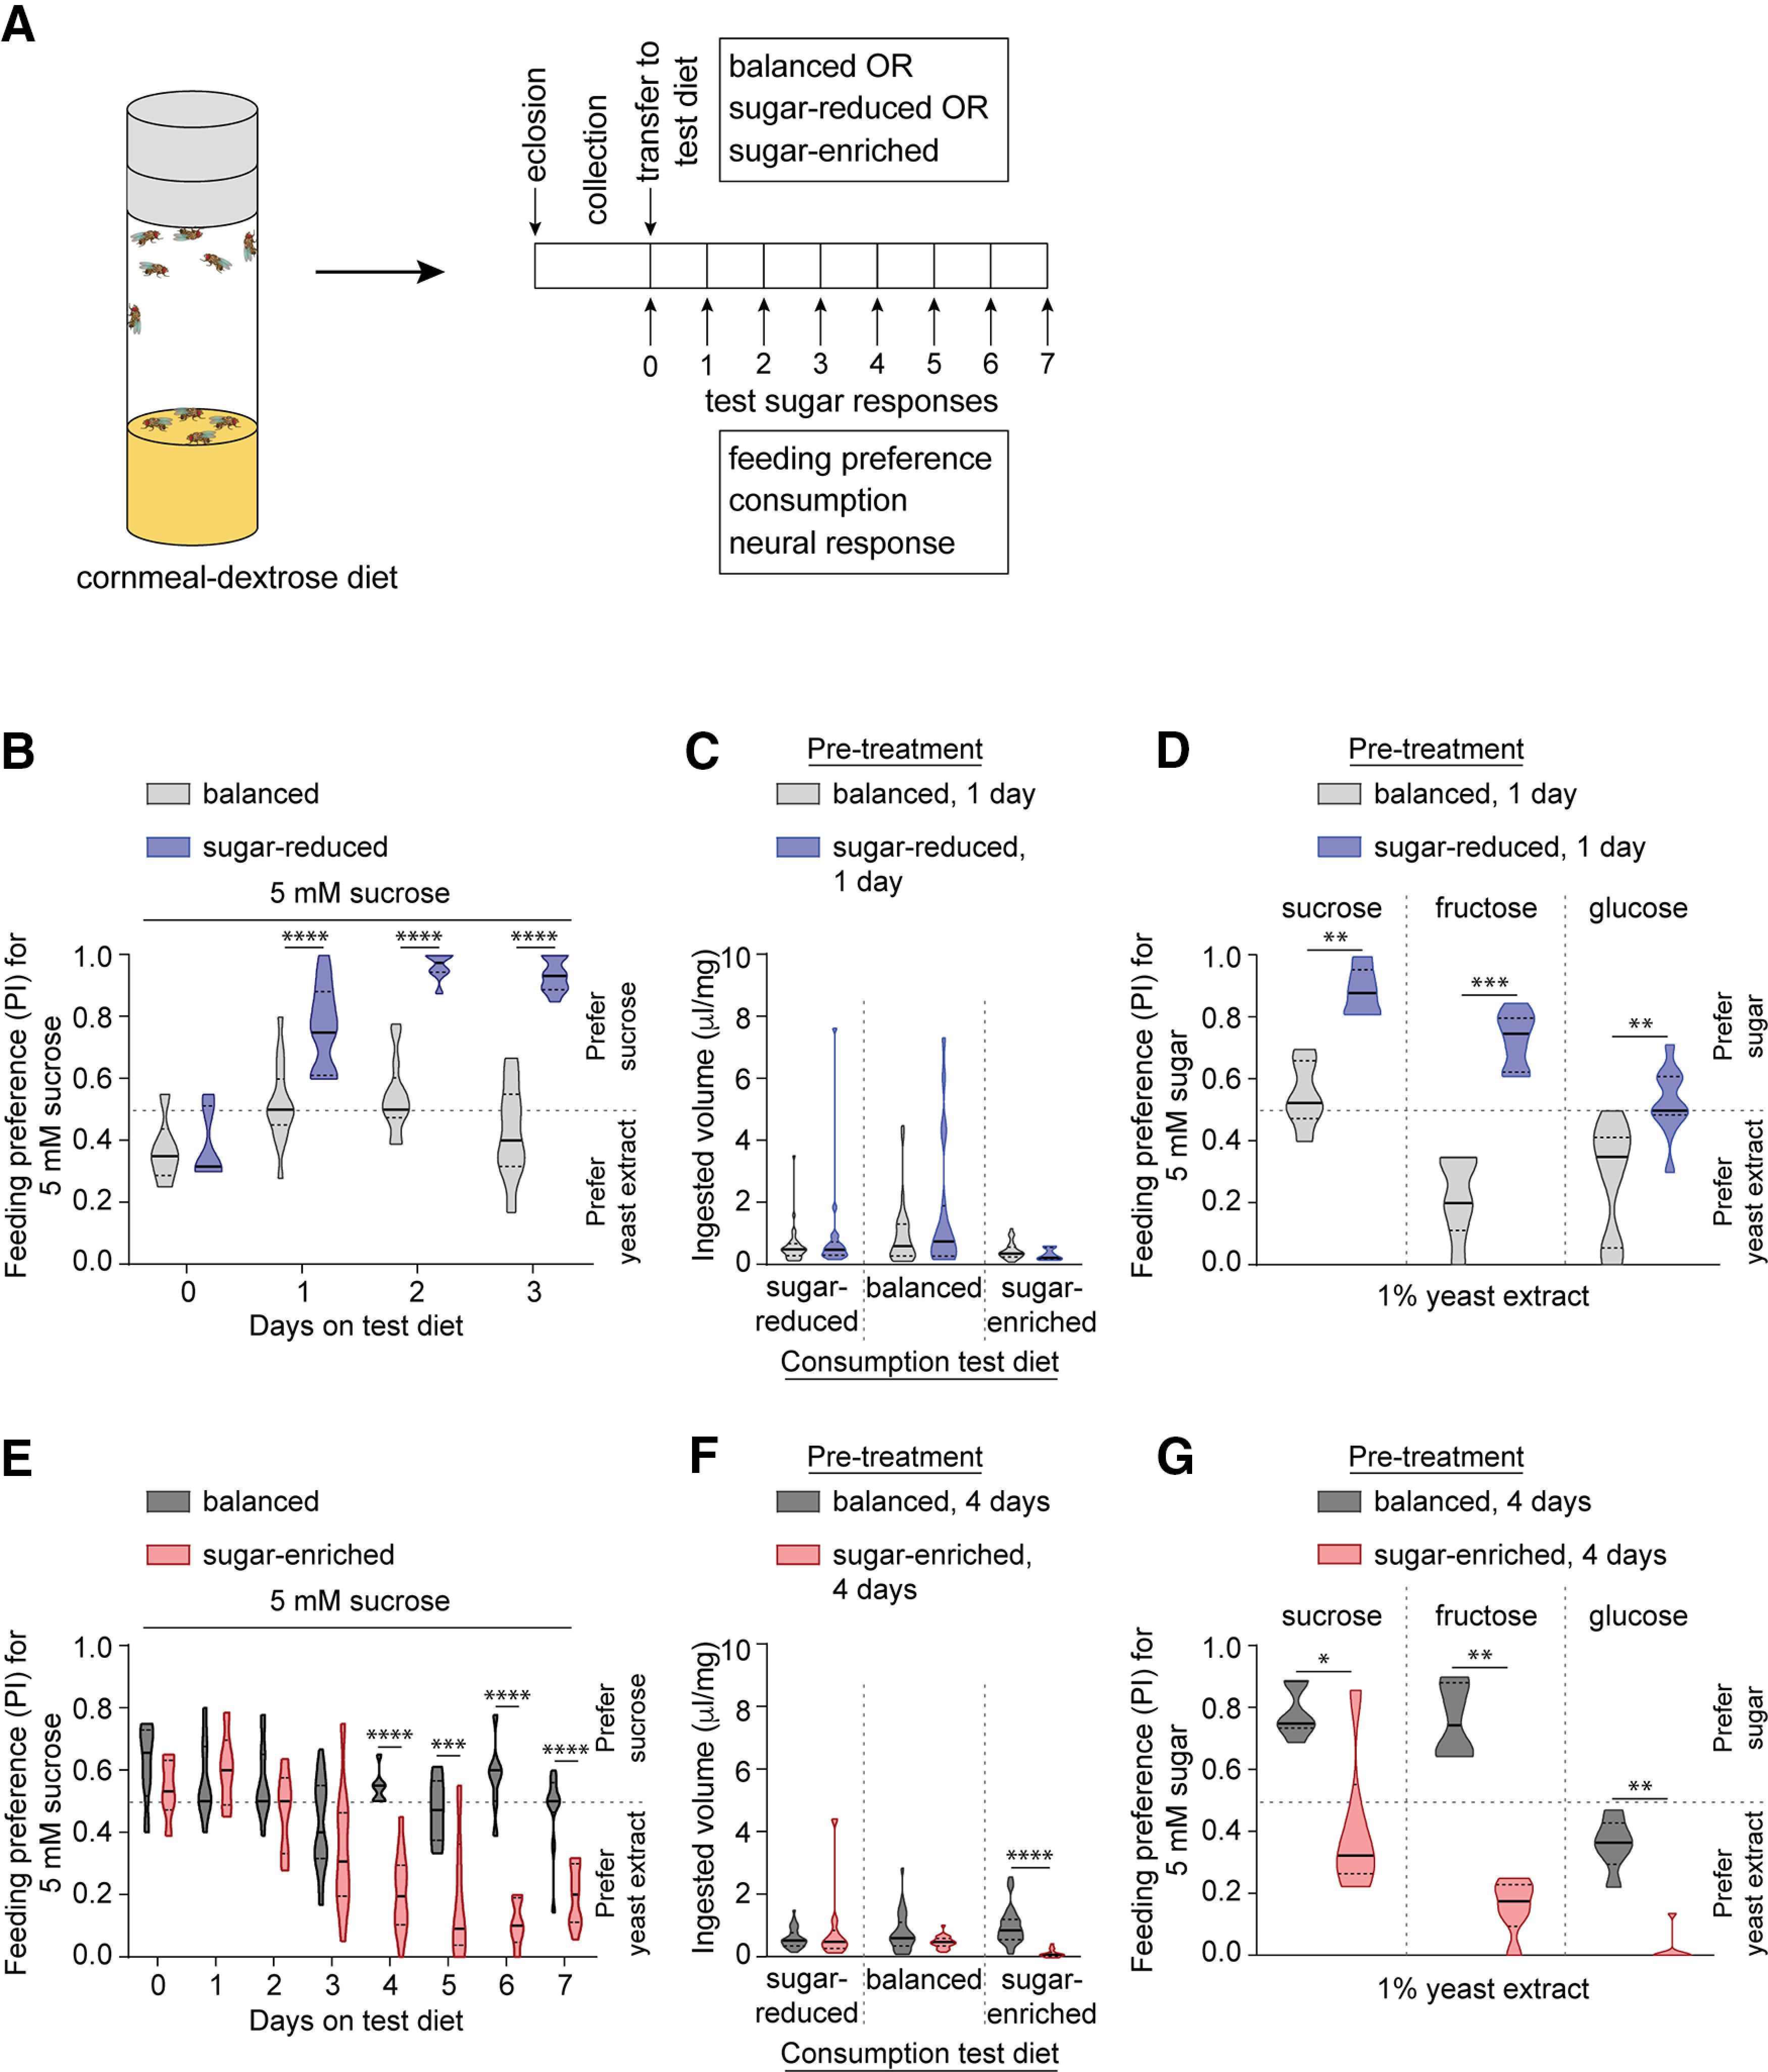
Dietary sugar-protein imbalance leads to shifts in feeding preference. A, Schematic representing the experimental strategy to evaluate diet-induced alteration of taste sensitivity and preference. B, Preference of mated females (and males, see Extended Data Fig. 1-1) fed on indicated diet for 5 mm sucrose (blue dye) tested against 1% yeast extract (pink dye) in binary choice assays; n = 6 balanced (0 d), 6 sugar-reduced (0 d), 15 balanced (1 d), 13 sugar-reduced (1 d), 13 balanced (2 d), 8 sugar-reduced (2 d), 17 balanced (3 d), 15 sugar-reduced (3 d). Feeding participation of males and females prefed on the balanced or sugar-reduced diets is shown in Extended Data Figures 1-1, 1-2. C, Ingested volume (μl) of indicated diet normalized to body weight (mg) in mated females prefed with indicated diet for 1 d and then tested for 2-h consumption of sugar-reduced (n = 35, 18), balanced (n = 35, 19), or sugar-enriched (n = 31, 10) diets. Head and body weights of females prefed on the balanced or sugar-reduced diets for 1 d are shown in Extended Data Figure 1-3. D, Preference of mated females prefed on indicated diet for 5 mm sugar (blue dye) tested against 1% yeast extract (pink dye) in binary choice assays; n = 6 sucrose, 7 fructose, 10 glucose for both balanced and sugar-reduced. E, Preference of mated females (and males, see Extended Data Fig. 1-4) prefed on indicated diet for 5 mm sucrose (blue dye) tested against 1% yeast extract in binary choice assays; n = 6 balanced, 6 sugar-enriched (0 d), n = 9 balanced, 6 sugar-enriched (1 d), n = 13 balanced, 6 sugar-enriched (2 d), n = 17 balanced, 10 sugar-enriched (3 d), n = 7 balanced, 16 sugar-enriched (4 d), n = 6 balanced, 6 sugar-enriched (5 d), n = 7 balanced, 6 sugar-enriched (6 d), n = 10 balanced, 11 sugar-enriched (7 d). Feeding participation of males and females prefed on the balanced or sugar-enriched diets are shown in Extended Data Figures 1-4, 1-5. F, Ingested volume (μl) of indicated diet normalized to body weight (mg) in mated females prefed with indicated diet for 4 d and then tested for 2-h consumption of sugar-reduced (n = 34, 10), balanced (n = 28, 21), or sugar-enriched (n = 31, 21) diets. Head and body weights of females prefed on the balanced or sugar-enriched diets for 4 d are shown in Extended Data Figure 1-6. G, Preference of mated females prefed on indicated diet for 5 mm sugar (blue dye) tested against 1% yeast extract (pink dye) in binary choice assays; n = 6 sucrose, 6 fructose, 6 glucose for both balanced and sugar-enriched. Diet-induced changes in feeding preference are compared in starved and unstarved females in Extended Data Figure 1-7. For all graphs, *p < 0.05, **p < 0.01, ***p < 0.001, ****p < 0.0001. Data in B, C, E, F were analyzed using two-way ANOVA with Sidak's post hoc multiple comparisons test. Data in D, G were analyzed with the Mann–Whitney test.
