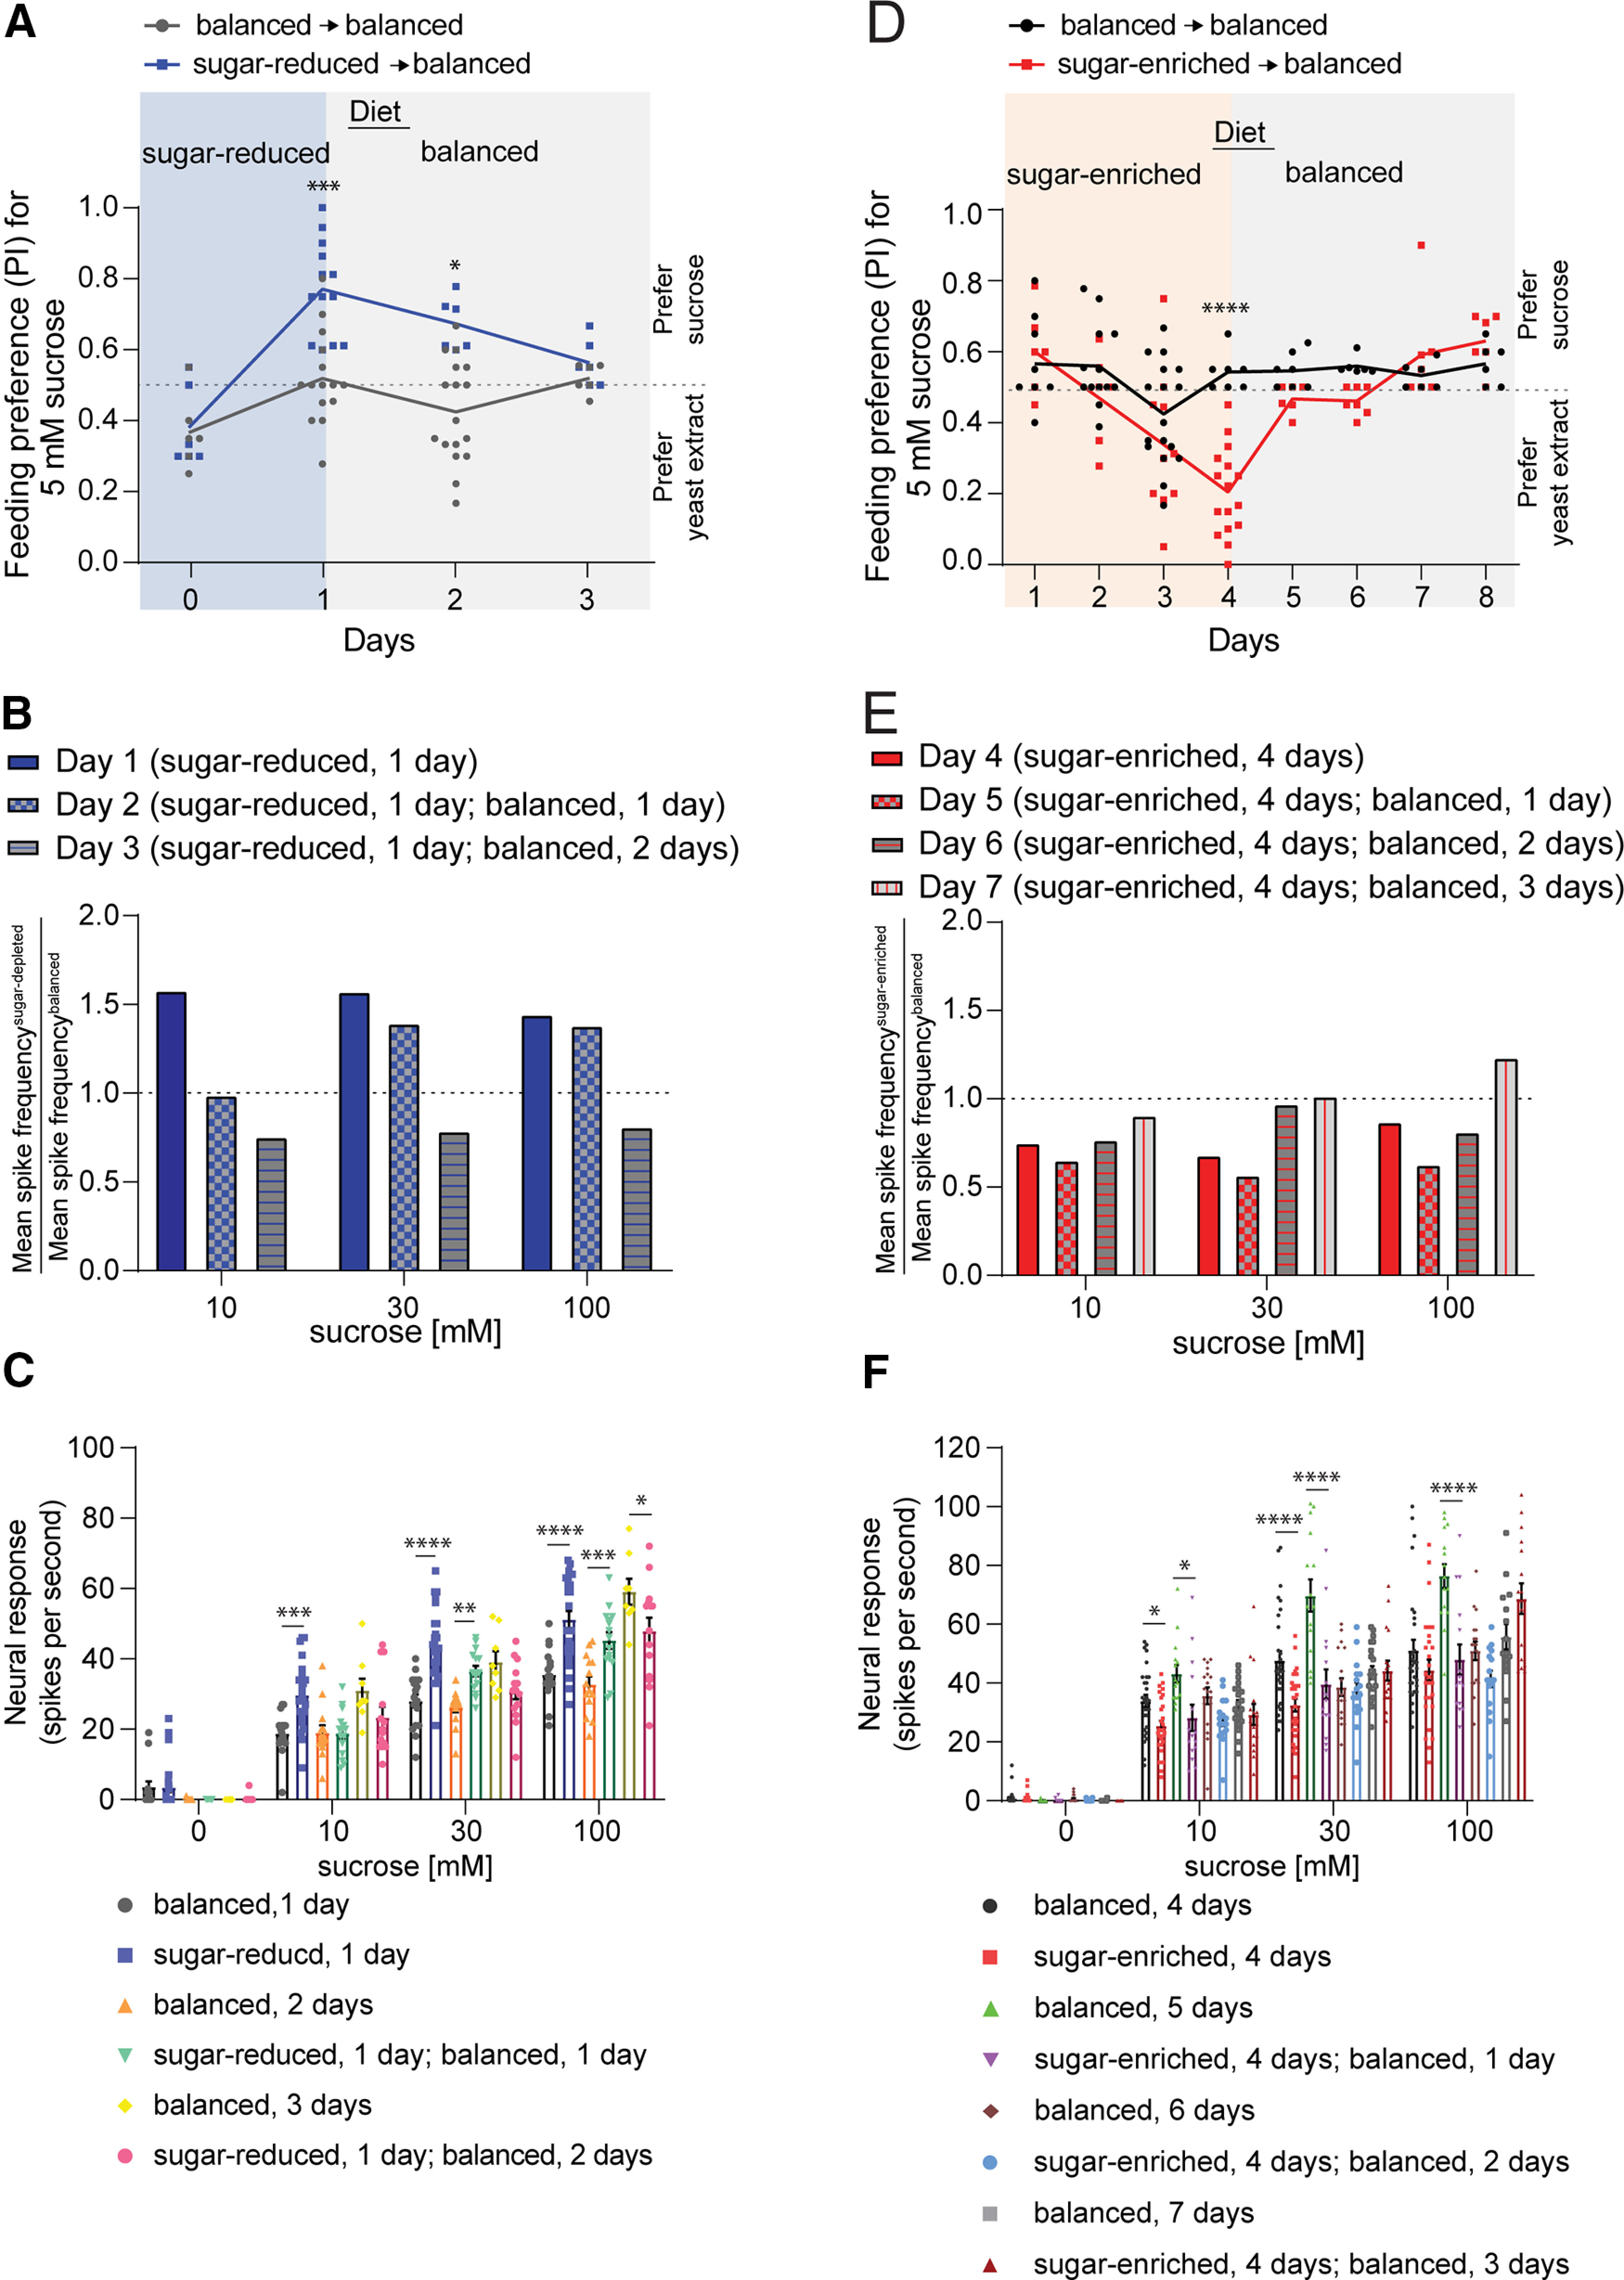
Figure 3.

Dietary sugar-protein imbalance-induced alterations in sweet taste and behavior are reversible. A, Preference of mated females for 5 mm sucrose (blue dye) tested against 1% yeast extract (pink dye) in binary choice assays. Flies were treated to indicated dietary regimens and tested daily; n = 6 balanced, 6 sugar-reduced (0 d); n = 15 balanced, 13 sugar-reduced (1 d); n = 17 balanced, 6 sugar-reduced (2 d); n = 6 balanced, 6 sugar-reduced (3 d). B, Ratio of mean sweet neuron response in flies fed on sugar-reduced diet (test) to that from flies fed on balanced diet (control). Flies were treated to different dietary regimens as in A and tested on indicated days with different concentrations of sucrose; n = 8–25 sensilla from two to five flies. The dotted line indicates a ratio of 1, i.e., equal taste sensitivity to sucrose in test and control flies. Tip recordings were taken from L-type labellar hairs in mated females. C, Mean neuronal responses used to generate the spike ratios shown in B. D, Preference of mated females for 5 mm sucrose (blue dye) tested against 1% yeast extract (pink dye) in binary choice assays. Flies were treated to indicated dietary regimens and tested daily; n = 9 balanced, 6 sugar-enriched (1 d); n = 13 balanced, 6 sugar-enriched (2 d); n = 17 balanced, 10 sugar-enriched (3 d); n = 7 balanced, 16 sugar-enriched (4 d); n = 7 balanced, 6 sugar-enriched (5 d); n = 6 balanced, 7 sugar-enriched (6 d); n = 6 balanced, 7 sugar-enriched (7 d); n = 6 balanced, 6 sugar-enriched (8 d). E, Ratio of mean sweet neuron response in flies fed on sugar-enriched diet (test) to that from flies fed on balanced diet (control). Flies were treated to different dietary regimens as in C and tested on indicated days with different concentrations of sucrose; n = 15–29 sensilla from three to six flies. The dotted line indicates a ratio of 1, i.e., equal taste sensitivity to sucrose in test and control flies. F, Mean neuronal responses used to generate spike ratios shown in E. Data in A, D were analyzed using two-way ANOVA with Sidak's post hoc multiple comparisons test; data in C, F were analyzed using two-way ANOVA with Tukey's post hoc multiple comparisons test; *p < 0.05, **p < 0.01, ***p < 0.001, ****p < 0.0001.
