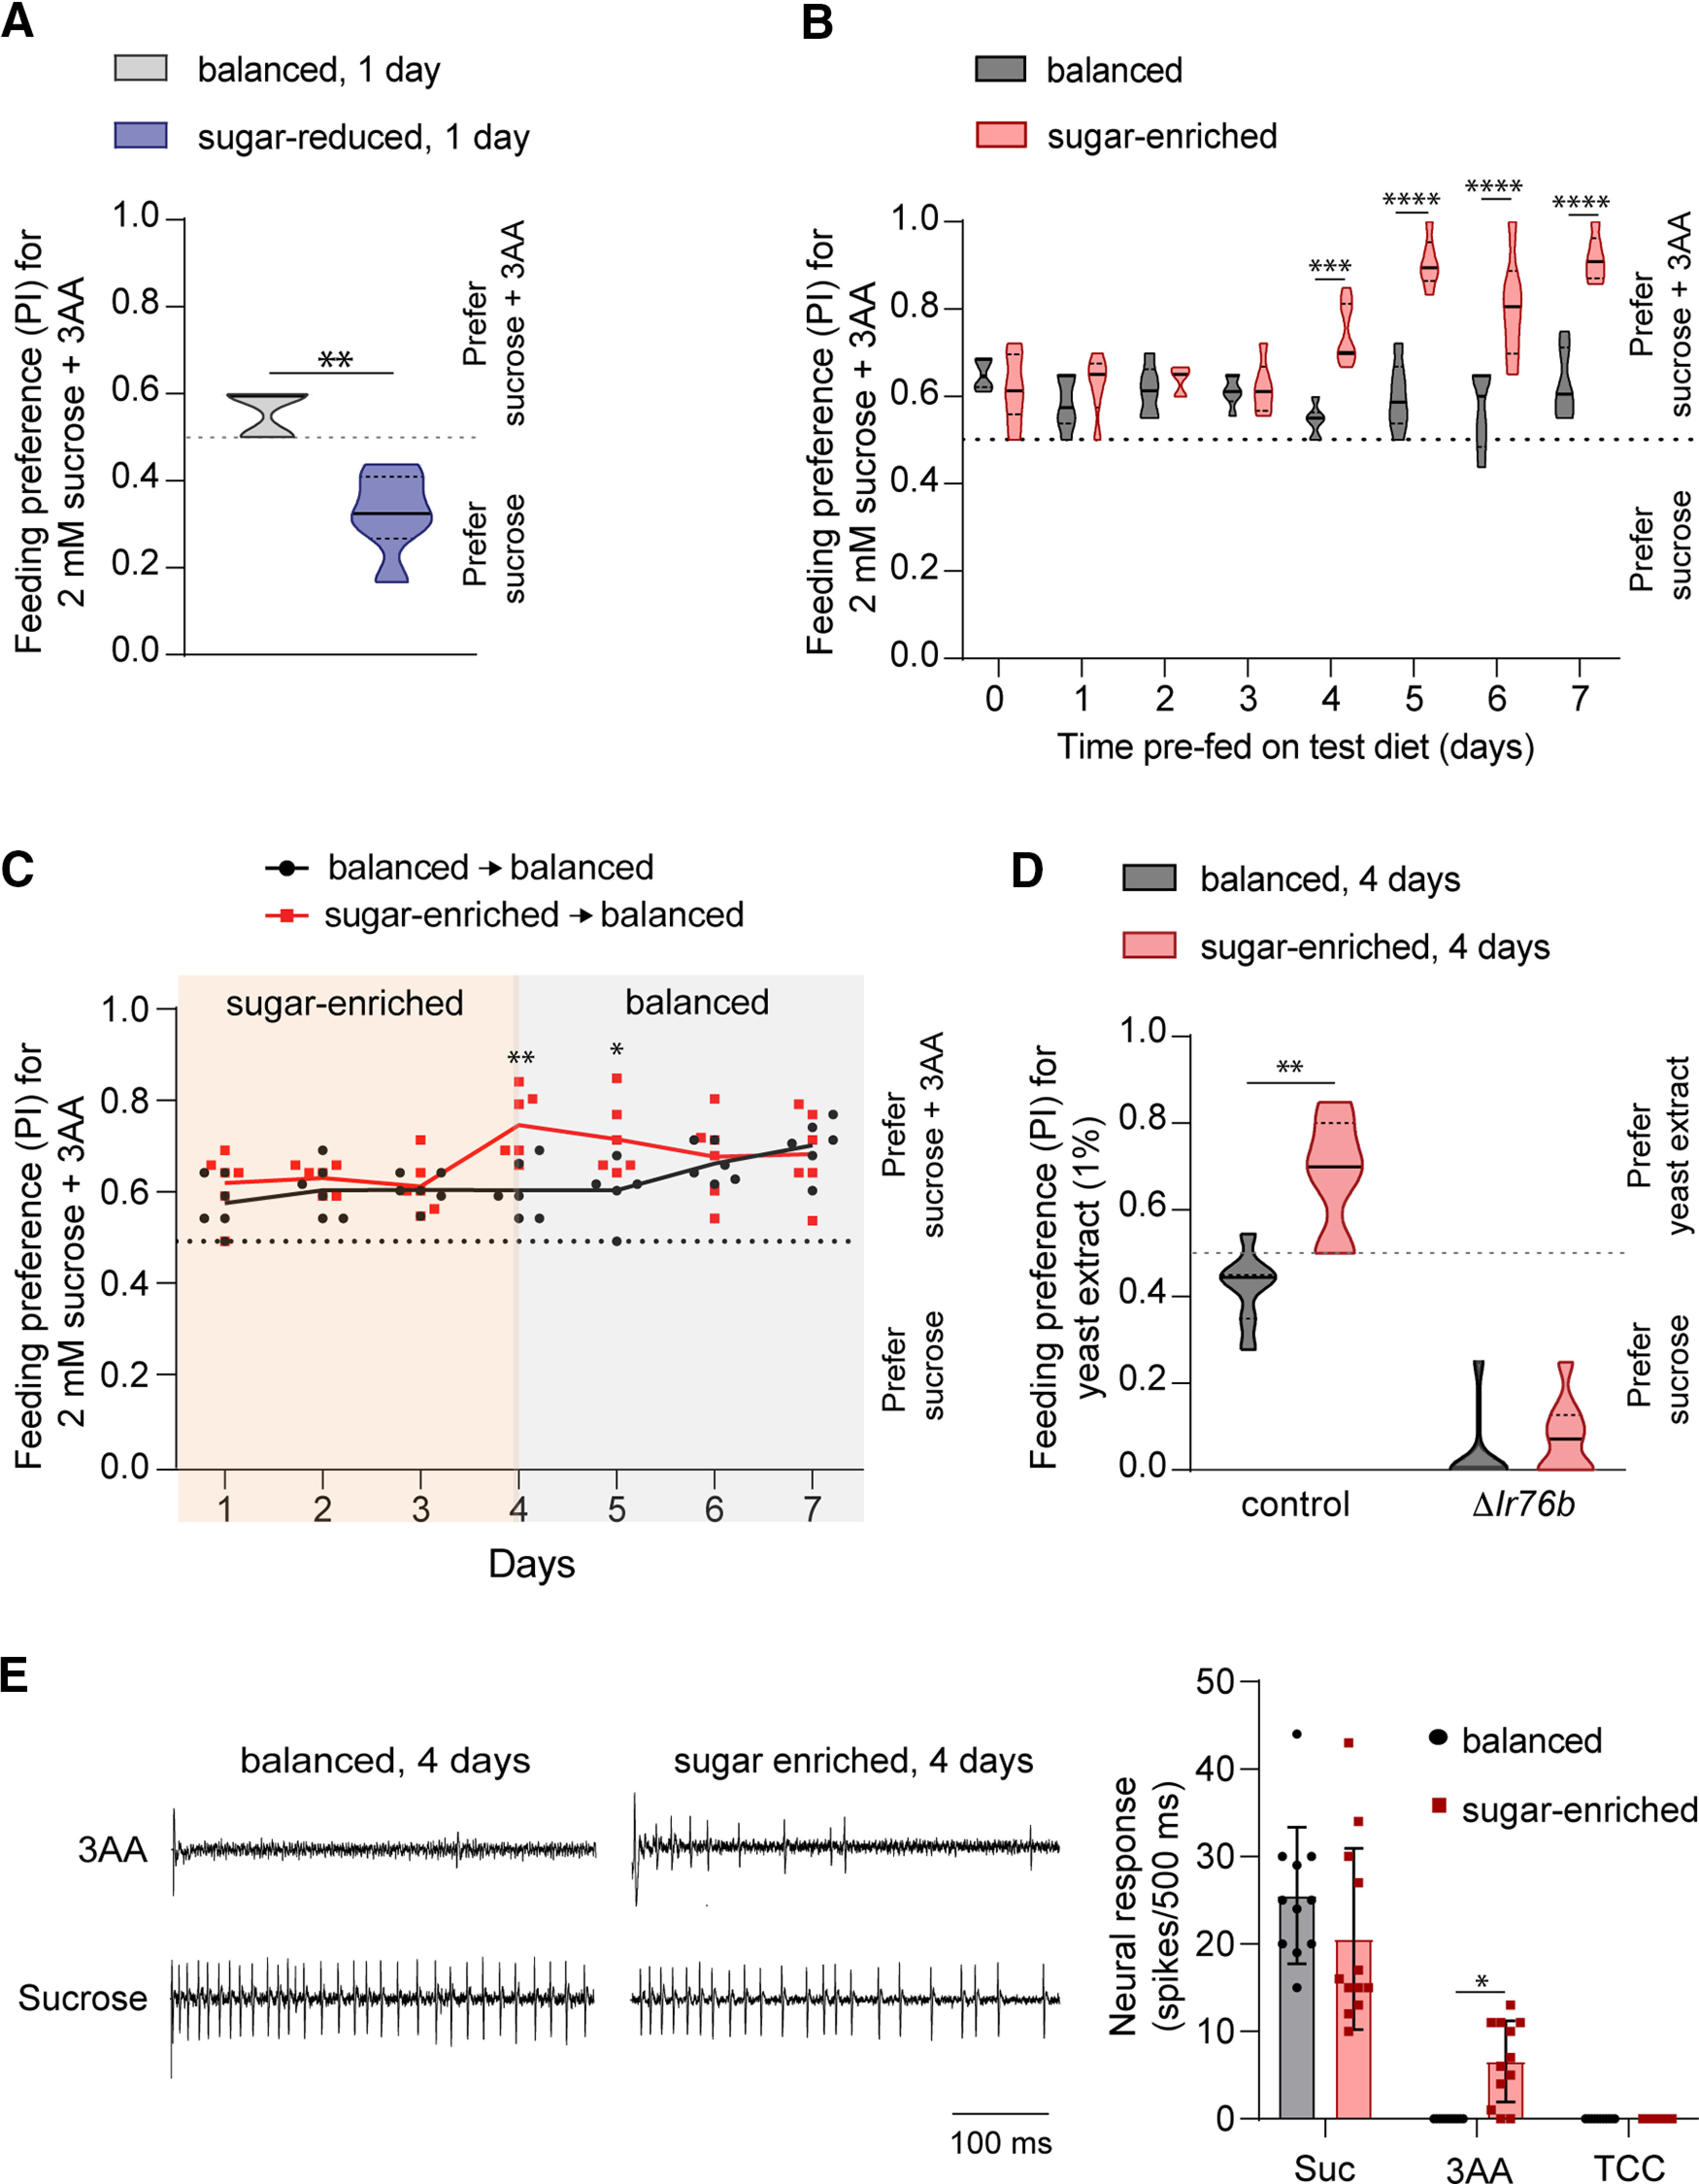
Figure 4.

Dietary sugar-protein imbalance alters feeding preference for amino acids. A, Preference of mated females prefed on indicated diet for 1 d for 2 mm sucrose mixed with 25 mm each of serine, phenylalanine, and threonine (pink dye, sucrose + 3AA) tested against 2 mm sucrose alone (blue dye) in binary choice assays; n = 5 (balanced), n = 6 (sugar-reduced). B, Preference of mated females fed on indicated diet for 2 mm sucrose mixed with 25 mm each of serine, phenylalanine, and threonine (pink dye, sucrose + 3AA) tested against 2 mm sucrose alone (blue dye) in binary choice assays. Flies were tested daily on start of the indicated diet; n = 6 balanced (0–3 d), 10 (4 d), 6 (5–7 d); n = 6 sugar-enriched (0–3 d), 7 (4 d), 6 (5–7 d). C, Preference of mated females for 2 mM sucrose mixed with 25 mM each of serine, phenylalanine, and threonine (pink dye, sucrose + 3AA) tested against 2 mM sucrose alone (blue dye) in binary choice assays. Flies were treated to indicated dietary regimens and tested daily; n = 6 for each condition. D, Preference of mated females of control (w1118) and ΔIr76b (Ir76b1) genotypes prefed on the indicated diet for 4 d for 1% yeast extract (pink dye) tested against 5 mm sucrose (blue dye) in binary choice assays; n = 7 balanced, 7 sugar-enriched (control), n = 10 balanced, 9 sugar-enriched (ΔIr76b). E, Representative traces of the first 500-ms period of tip recordings from sensilla stimulated with a 3AA mixture of serine (100 mm), threonine (100 mm), and phenylalanine (25 mm) or 100 mm sucrose (left). Before testing, flies were prefed with the indicated diet for 4 d. Neuronal responses in the first 500-ms period on stimulation with indicated tastant or 30 mm tricholine citrate electrolyte (TCC; right). Flies were prefed with the indicated diet for 4 d; n = 11 (balanced), n = 12 (sugar-enriched) from five to six flies. For all graphs, *p < 0.05, **p < 0.01, ***p < 0.001, ****p < 0.0001. Statistical comparisons were made using the Mann–Whitney test (A, D) or two-way ANOVA with Sidak's post hoc multiple comparisons test (B, C, E).
