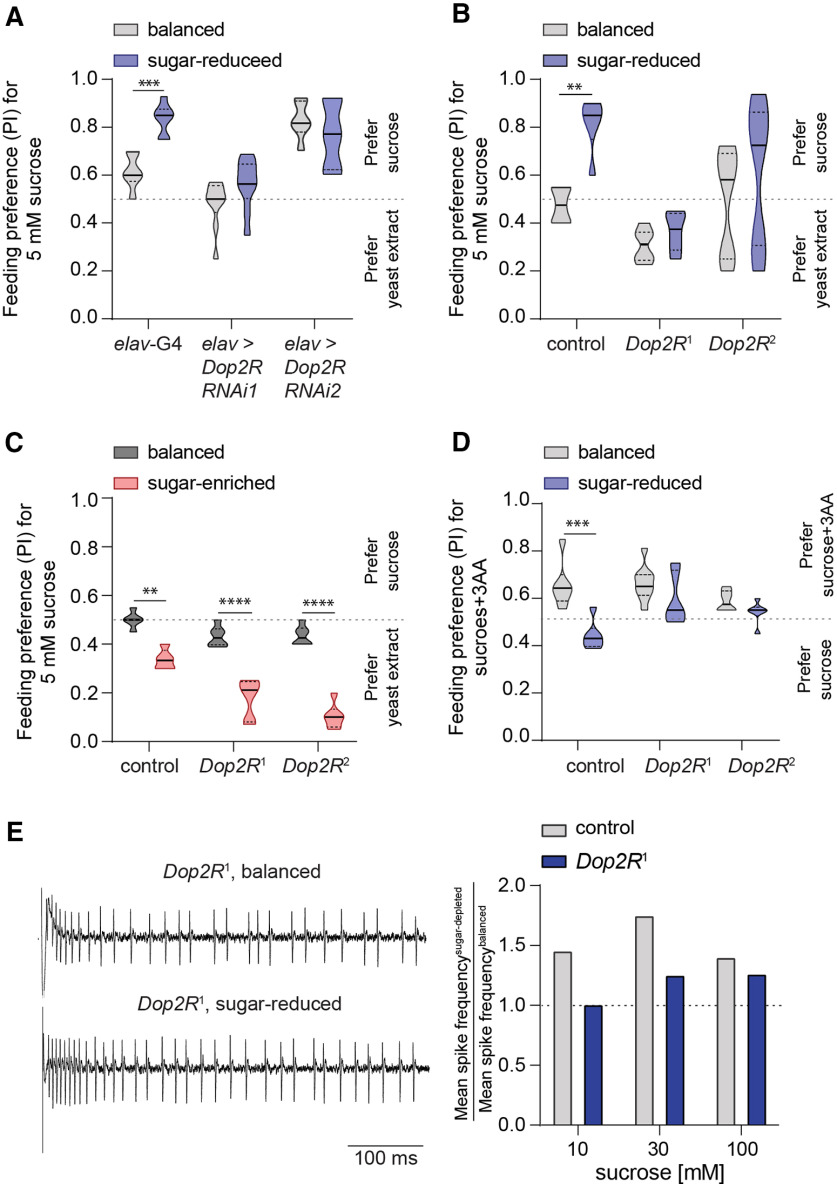
Figure 5.
Dop2R is required for sugar-deprivation induced rise in sweet taste and preference. A, Preference of mated females prefed on indicated diet for 1 d and tested in binary choice assays with 5 mm sucrose (blue dye) against 1% yeast extract (pink dye). Genotypes were as follows: elav-Gal4 (n = 6 balanced, 7 sugar-reduced), elav-Gal4>UAS-Dop2R RNAi1 (elav>D2R RNAi1, n = 9 balanced, 9 sugar-reduced), and elav-Gal4>UAS-Dop2R RNAi2 (elav>D2R RNAi2, n = 6 balanced, 6 sugar-reduced). Levels of Dop2R expression were measured by reverse transcriptase-PCR in wild-type females fed on balanced or sugar-reduced diet for 1 d (see Extended Data Fig. 5-1) and in elav-Gal4>UAS-Dop2R RNAi1 flies (see Extended Data Fig. 5-2). B, Feeding preference and participation (see Extended Data Fig. 5-3) of mated females prefed on indicated diet for 1 d and tested in binary choice assays with 5 mm sucrose (blue dye) against 1% yeast extract (pink dye). Genotypes were as follows: w1118 (control, n = 6 balanced, 6 sugar-reduced), BDSC#52025 (Dop2R1, n = 6 balanced, 6 sugar-reduced) and BDSC#52517 (Dop2R2, n = 10 balanced, 10 sugar-reduced). The observed shift in food choice differs from a starvation-induced effect (see Extended Data Figs. 5-4, 5-5). C, Preference of mated females prefed on indicated diet for 4 d and tested in binary choice assays with 5 mm sucrose (blue dye) against 1% yeast extract (pink dye). Genotypes were w1118 (control, n = 5 balanced, 5 sugar-enriched), BDSC#52025 (Dop2R1, n = 6 balanced, 6 sugar-enriched), and BDSC#52517 (Dop2R2, n = 6 balanced, 6 sugar-enriched). D, Preference of mated females prefed on indicated diet for 1 d and tested in binary choice assays with 2 mm sucrose mixed with 25 mm each of serine, phenylalanine, and threonine (sucrose + 3AA, pink dye) against 2 mm sucrose alone (blue dye). Genotypes were w1118 (control, n = 6 balanced, 6 sugar-reduced), BDSC#52025 (Dop2R1, n = 9 balanced, 9 sugar-reduced), and BDSC#52517 (Dop2R2, n = 6 balanced, 6 sugar-reduced). E, Representative traces obtained from Dop2R1 mutant females (left) and ratio of mean sweet neuron response (right) of flies fed on sugar-reduced diet (test) to that from flies fed on balanced diet (control) for 1 d. Mean neuronal responses are shown in Extended Data Figure 5-6. Recordings were taken from labellar L-type sensilla of five to six flies for each genotype. Genotypes tested were w1118 (control, n = 25–29) and BDSC#52025 (Dop2R1, n = 22–23). The dotted line indicates a ratio of 1, i.e., equal taste sensitivity to sucrose in test and control flies. Data in A–D were analyzed using two-way ANOVA with Sidak's post hoc multiple comparisons test, *p < 0.05, **p < 0.01, ***p < 0.001, ****p < 0.0001. Expression of Dop2R RNAi in Gad1-GAL4 neurons but not in Gr64f-GAL4 or other classes of neurons phenocopied the Dop2R mutant (see Extended Data Figs. 5-7, 5-8, 5-9, 5-10, 5-11).

