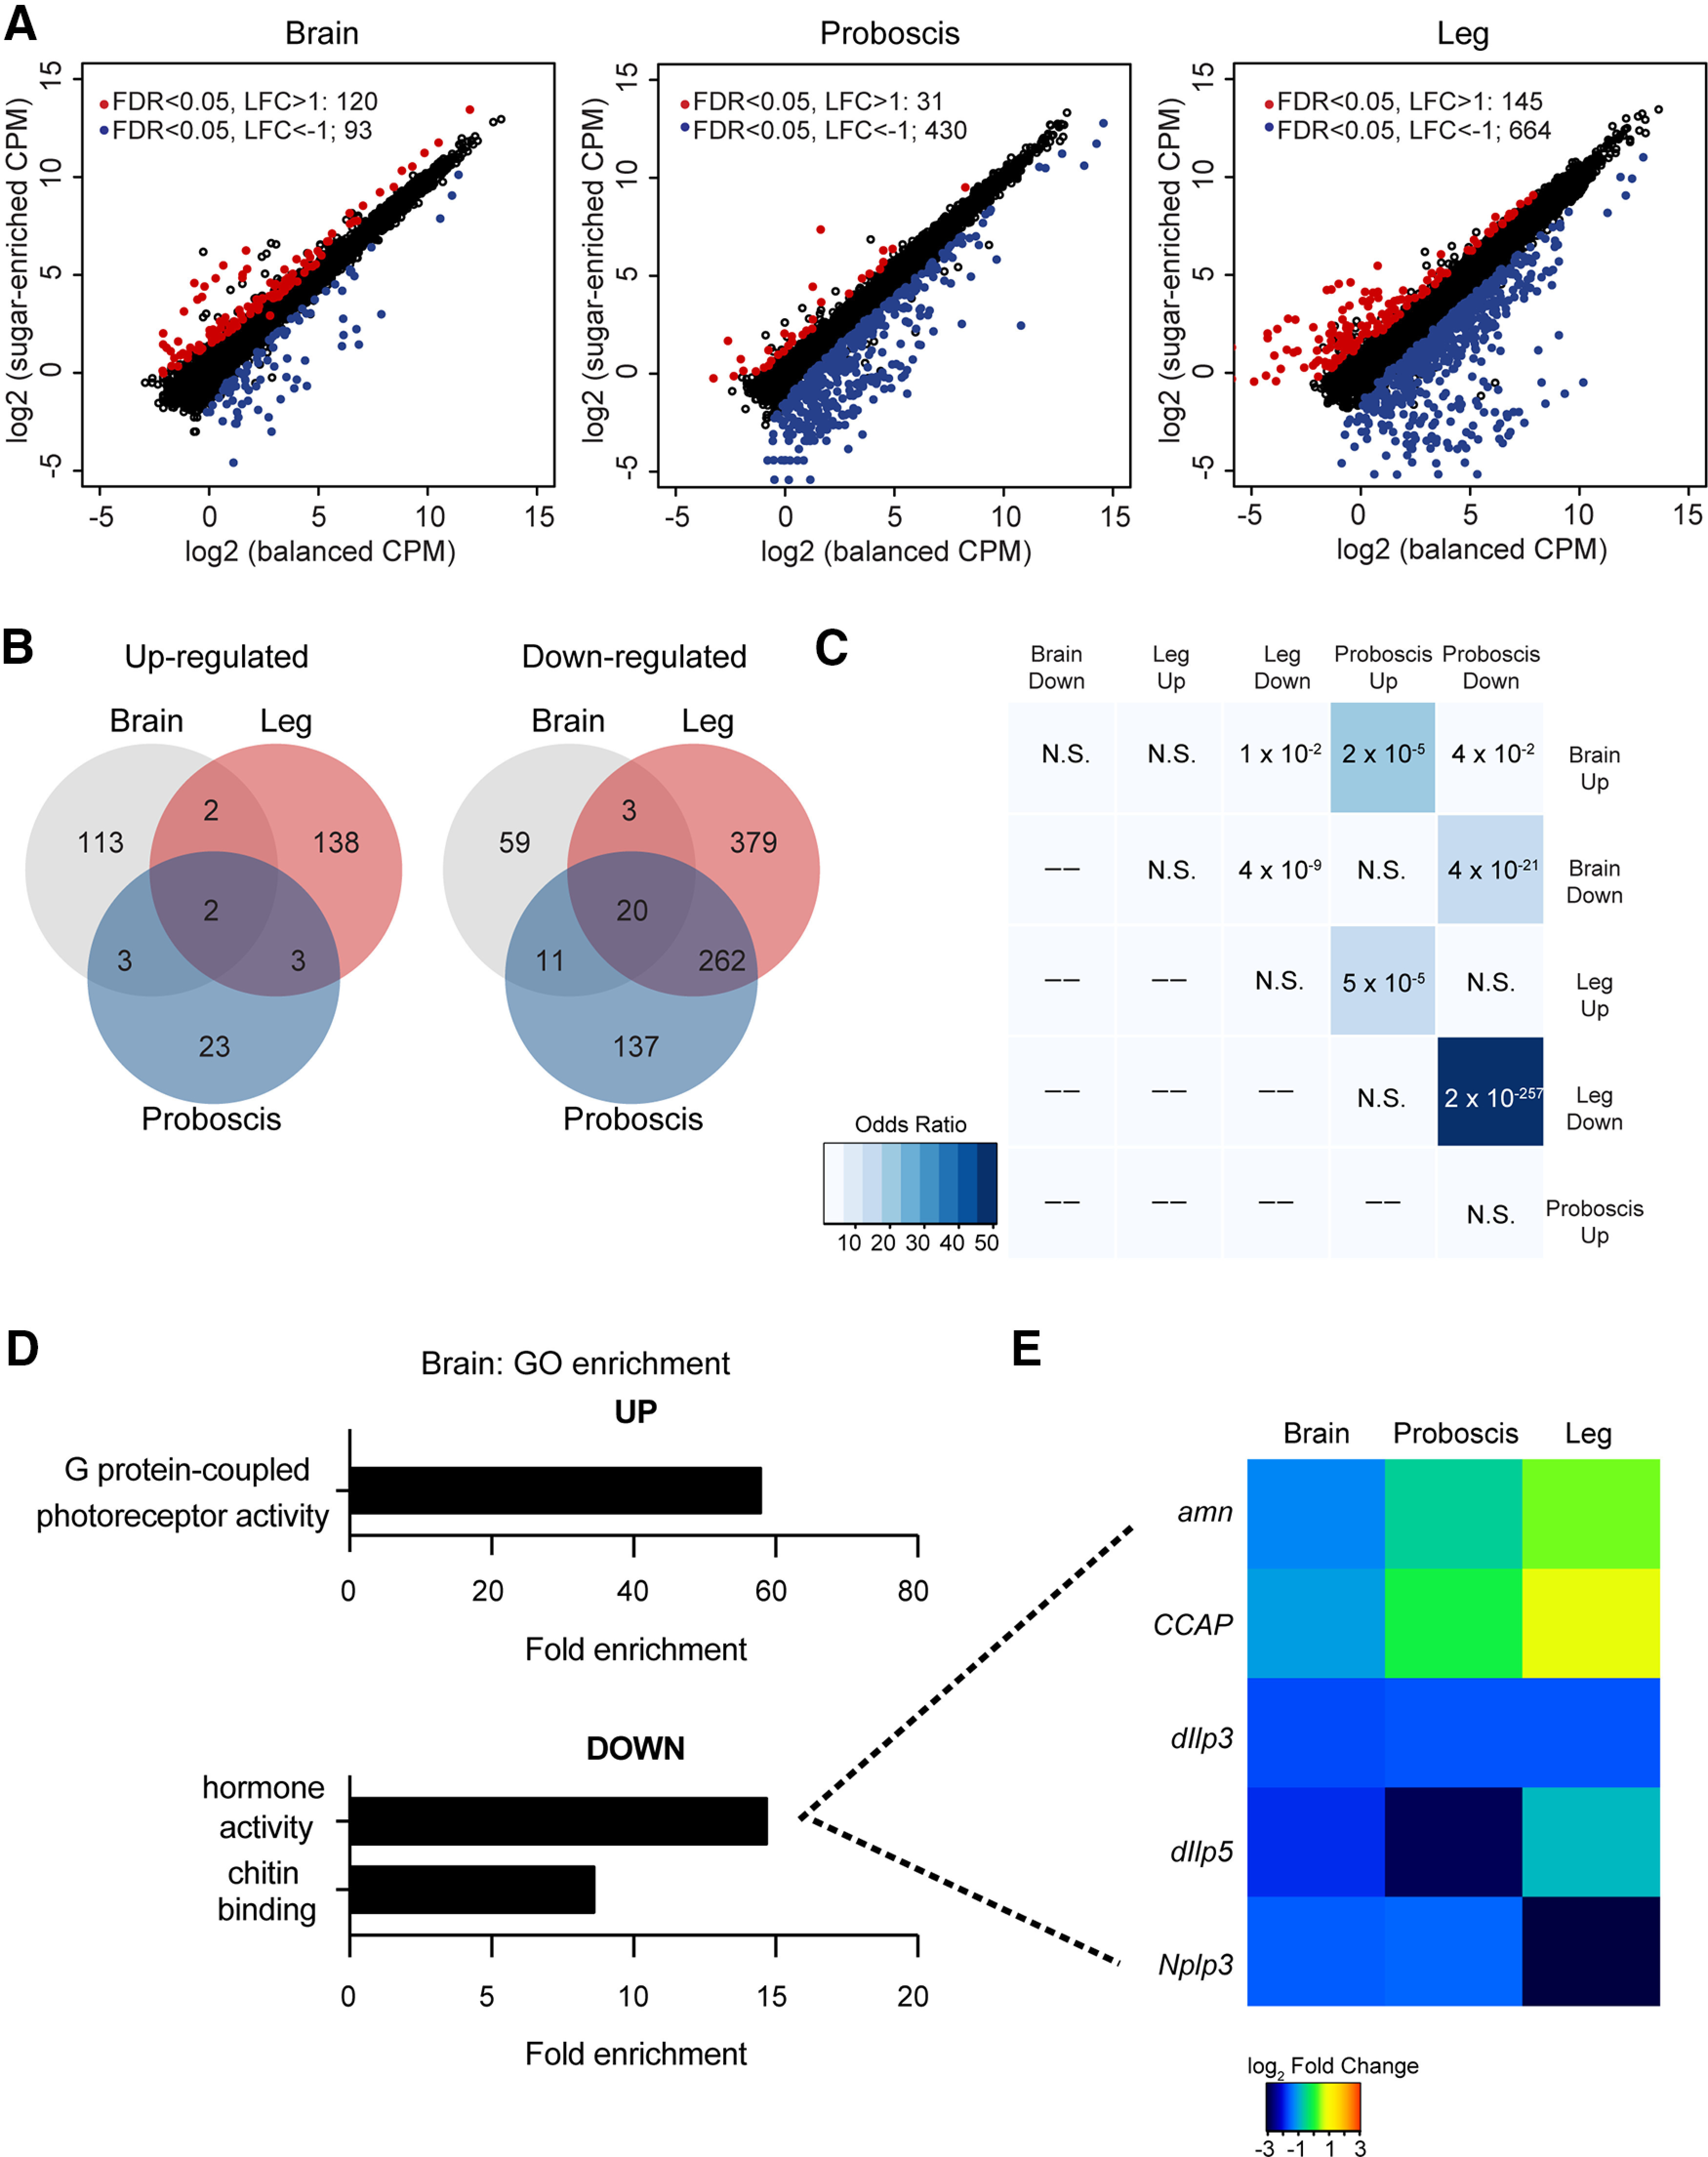
Figure 6.

Gene expression analyses reveal a downregulation of insulin-like peptides (dILPs) on feeding on the sugar-enriched diet. A, Plots highlighting upregulated and downregulated genes in the brain, proboscis, and legs. Red and blue dots represent upregulated genes [Log2fold change (LFC) > 1, FDR < 0.05] and downregulated genes (LFC < −1, FDR < 0.05), respectively. B, Overlap of upregulated (left) and downregulated (right) genes in each of the three tissues. C, Significance of overlap of indicated gene sets (p values indicated in boxes; colors denote odds ratio from Fisher's exact test). D, Fold-enrichment for molecular function GO terms in genes upregulated and downregulated in the brain (p < 0.05). E, Heatmap depicting expression of brain-regulated genes associated with the “hormone activity” GO terms across all experiments. Each row represents the expression of one gene, normalized across samples (red = high expression, blue = low expression). All comparisons are relative to the balanced diet. Diet-induced changes in expression of dilp3 and dilp5 were tested by qRT-PCR (see Extended Data Fig. 6-1).
