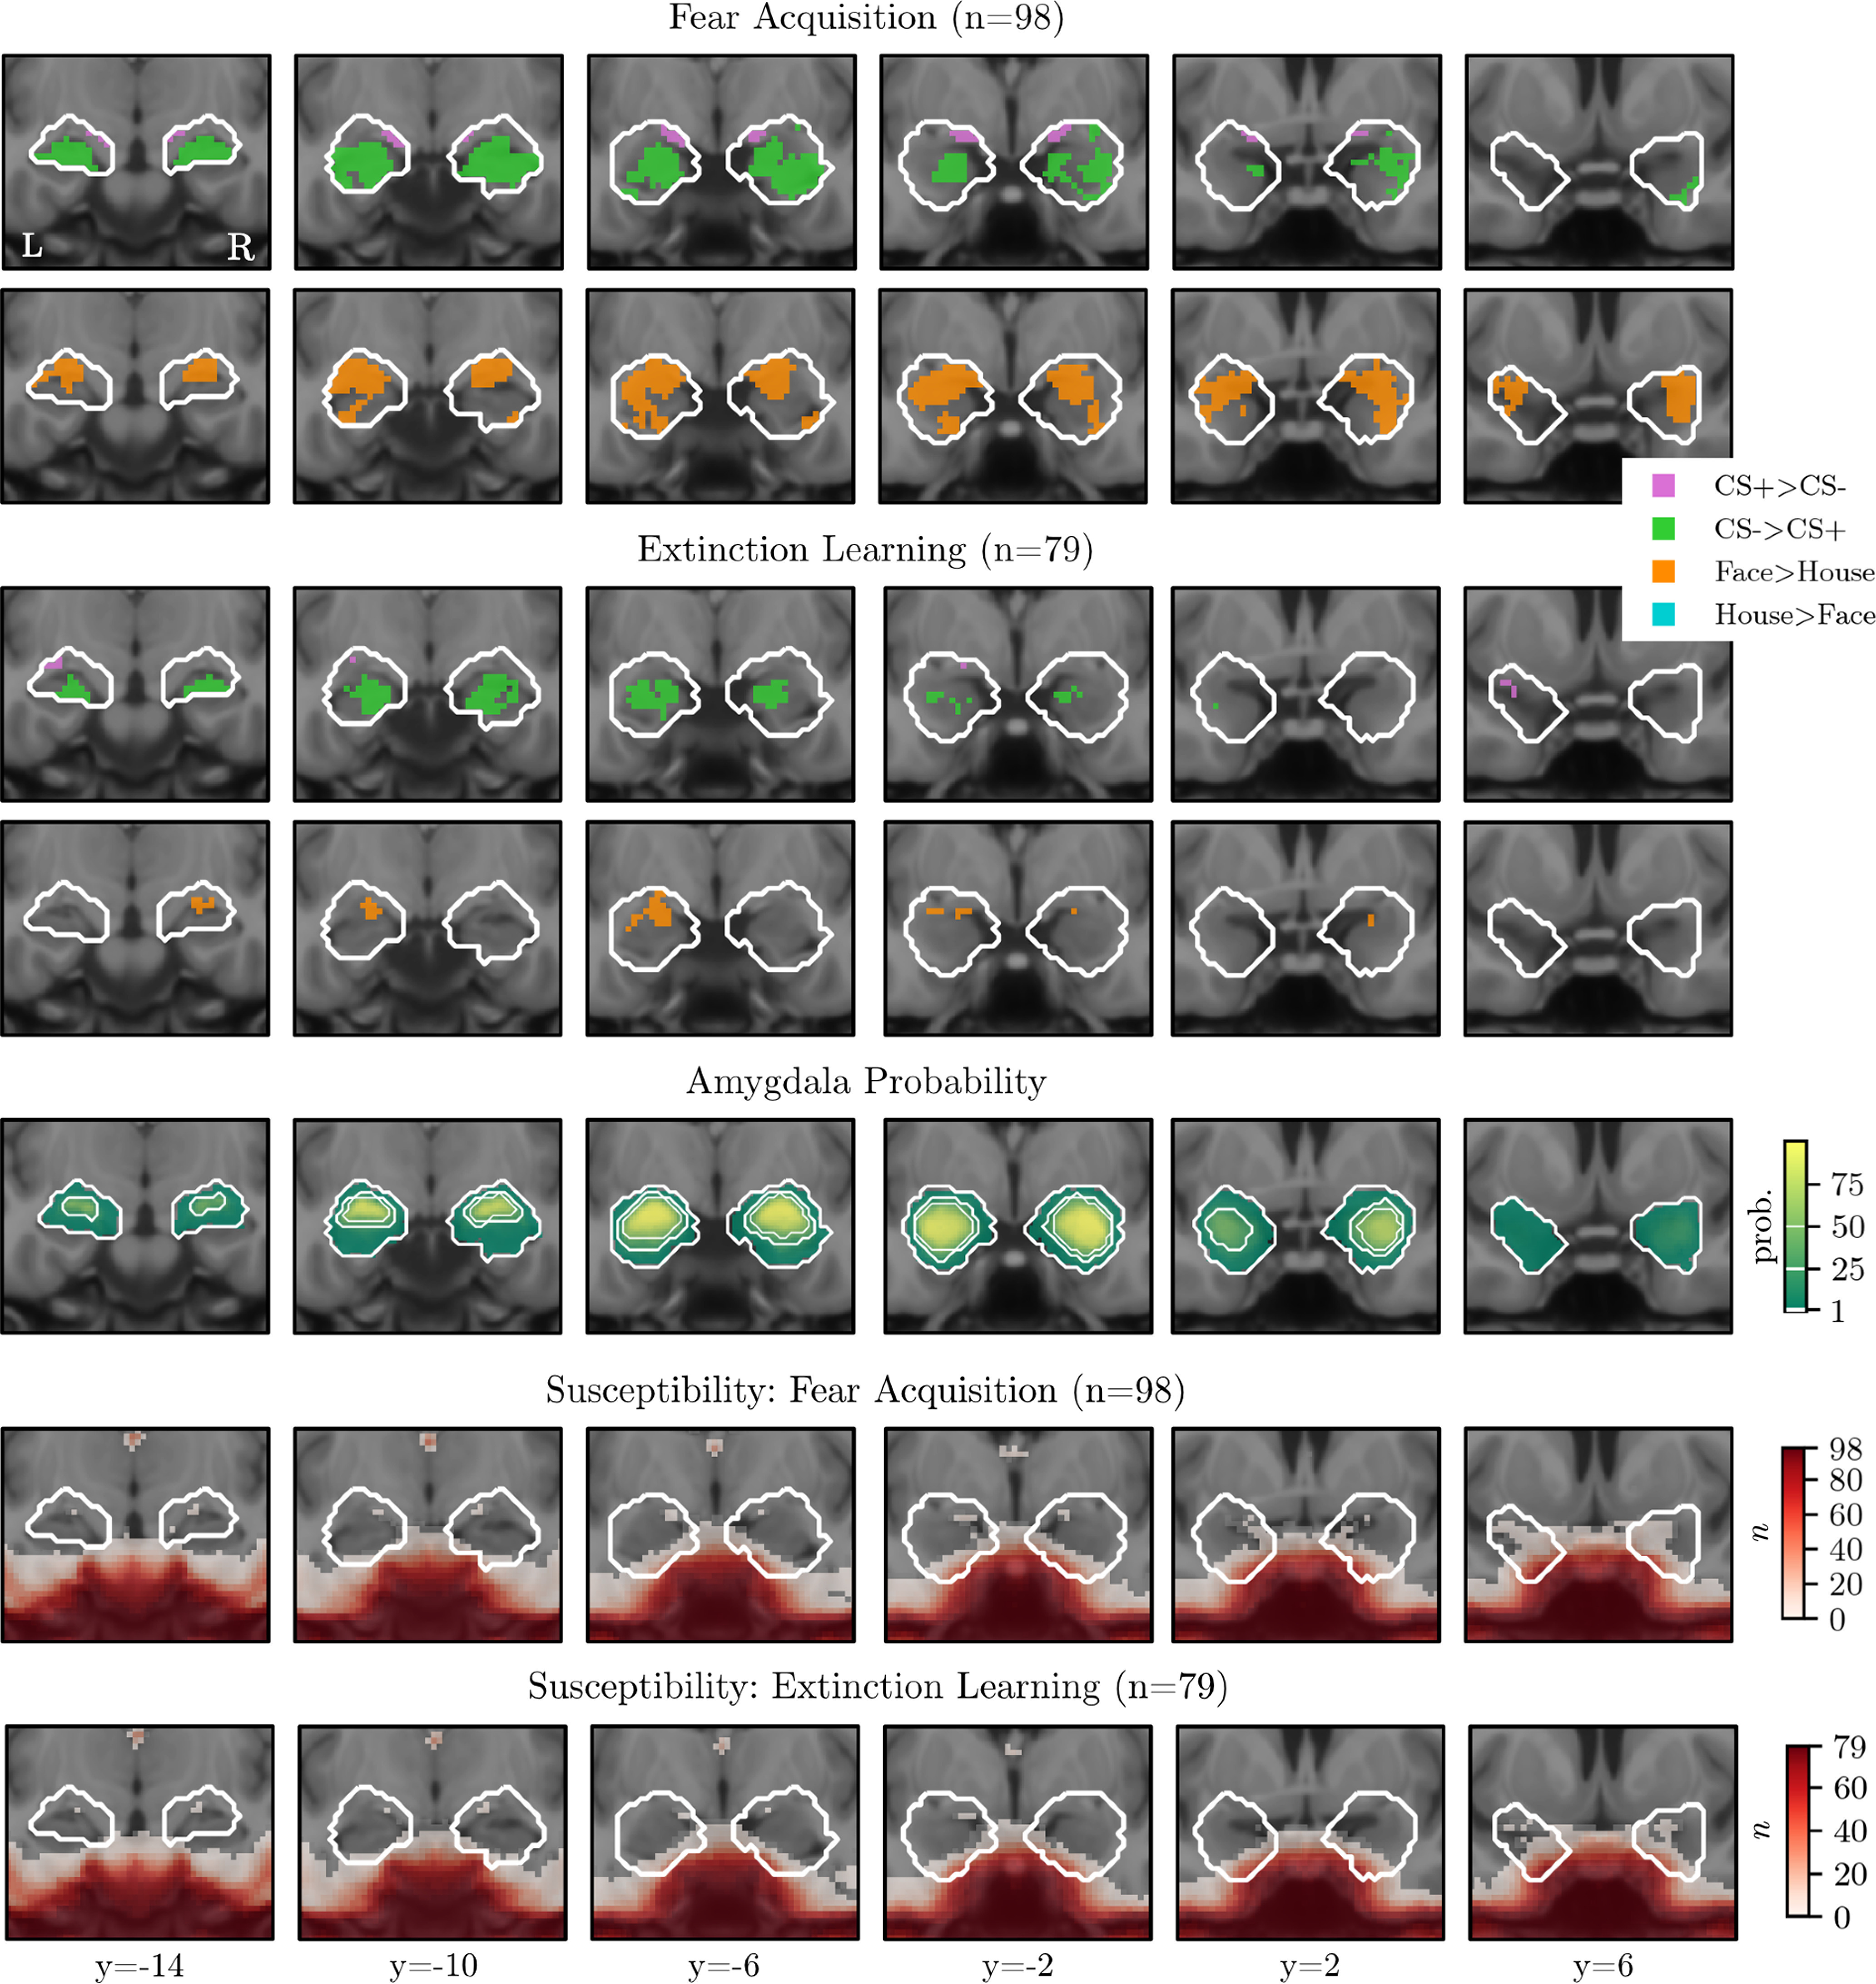
Figure 2.

Overview of the voxel-wise ROI analysis. Data were minimally spatially smoothed (2 mm). The top four rows show significant voxels (TFCE corrected, p < 0.05) within the amygdala mask (Harvard-Oxford, thresholded at p > 0.01), during fear acquisition (rows 1 and 2) and extinction learning (rows 3 and 4). The fifth row depicts the probabilistic ROI, with white outlines representing the different thresholds used to create binary masks. The bottom two rows depict the number of participants who had signal dropout in a particular voxel during fear acquisition and fear extinction. Coordinates refer to MNI space. L, Left; R, right.
