Abstract
The use of neutron imaging is demonstrated for visualizing and quantifying water distribution in partially saturated granular porous media. Because of the unique difference in the total neutron cross sections of water, sand, and air, a significant contrast for the three phases is observed in a neutron transmission image, and a quantitative analysis provides detailed information on the arrangement and distribution of particles, voids, and water. The experiments in this study are performed at the Neutron Imaging Facility (NIF) at the National Institute of Standard and Technology (NIST). An amorphous silicon flat panel detector was used in this research with a spatial resolution of approximately 250 μm (127 μm/pixel). The effect of particle morphology on water distribution in compacted granular columns is investigated by using round and angular silica sand. Silica sand specimens with different bulk gravimetric water contents (0%, 6%, 9%, and 12%) are studied for evaluating the water phase-distribution spatially for compacted sand specimens in an aluminum cylinder.
Keywords: Imaging techniques, Granular media, Porous media, Water content, Imaging, Sand, Water, Partially, Saturated, Neutrons, X-rays, Tomography, Three dimensional, Quantification
Introduction
The physics and mechanics of wet granular materials are important to understand in many real world applications since it is inevitable to have water in a granular material assembly. The mechanical behavior of partially saturated sand is largely affected by the nature of pore air, pore water, and wetting interfaces with sand particle contacts. It is well-known that because of negative capillary pore pressure, an assemblage of partially saturated sand particles can gain additional shear strength and stiffness, or modify the flow properties and mixing behavior of granular materials. However, the basic physics and mechanics of wet granular materials are only qualitatively understood at the macro scale and remain to be explored at the particle scale. The geometry and the distribution of water in a granular system are very complex and vary with water content. Water in a granular system is not uniformly distributed because of varying contact surfaces and complex interparticle void spaces. Water typically concentrates at the contact surfaces of the sand particles, creating stability of the granular system (Schiffer 2005). The mechanical properties of a partially saturated granular system are expected to be strongly dependent on the spatial distribution of the local water content at the particle scale.
X-ray tomography has been used routinely to study the physics of granular materials (Alshibli et al. 2000; Jaeger et al. 1996; Oda et al. 2004). X-ray imaging has been used effectively to study dry granular materials because of its high attenuation on silica. One of the earliest applications of X-ray tomography on rock and soil was performed by Wellington and Vinegar in studying petrophysical and fluid flow analysis (Wellington and Vinegar 1987). Desrues et al. have studied shear bands of soil samples with X-ray tomography (Desrues et al. 1996). The local void ratio in porous media systems has been measured with X-ray microtomography (Al-Raoush and Alshibli 2006). The distribution of liquid in a glass bead system using an aqueous zinc iodide solution as a wetting liquid was measured with X-ray microtomography (Scheel et al. 2008). It was demonstrated that the mechanical properties of a granular pile are affected by the local liquid organization in the granular system. Some researchers have visualized fluid phase in partially saturated soils by using a dual energy method with a contrast agent [e.g., cesium chloride (CsCl)] to separate the water phase from the air phase with a resolution in the order of 10 μm/pixel (Al-Raoush and Willson 2005; Han et al. 2006; Lu et al. 2010). In general, the contrast agents are typical salts and could change the wetting behavior of water attributed to having a different contact angle. For example, Schnaar and Brusseau estimated a 15–20° decrease of contact angle for ionic strength of 0.36 M CsCl solution on the basis of the result of Barranco et al. even though Schnaar and Brusseau determined that the presence of CsCl is not expected to significantly influence the phase-distribution behavior for the given condition (Barranco et al. 1997; Schnaar and Brusseau 2005). In many cases, however, it is difficult to estimate the effect of the change of contact angle on the water retention behavior especially on a porous media. Using the pure water without any contrast agent would eliminate any concern with the change of contact angle. In addition, contrast agents are not an option for studying samples from the environment.
Neutron imaging, a complementary method to the X-ray imaging technique for studying materials, provides unique contrast to locate small amounts of hydrogenous matter. Similar to X-rays, neutrons have the capability of penetrating materials for nondestructive evaluation. However, neutrons have different attenuation values (cross sections) from those of X-rays for all elements, since the neutron primarily interacts with the nucleus whereas X-rays primarily interact with the electron cloud. In particular, neutrons have relatively large cross sections for light elements such as hydrogen and relatively low cross sections for many metals such as aluminum and steel. These characteristics make neutrons ideal for imaging hydrogenous materials in a metallic matrix. In addition, in the past 10 years, the achievable spatial and temporal resolutions of neutron radiography have significantly improved primarily because of advances in digital detector technology. In particular, image spatial resolution of approximately 200 μm with temporal resolution less than 1 s is routine at most facilities, and detectors with a spatial resolution less than 20 μm are also widely available. This sensitivity to hydrogen and good spatial resolution have been used extensively to study water transport in proton exchange membrane fuel cells (Arif et al. 2008; Trabold et al. 2009) and in research areas including biology, material science, plant physiology, and homeland security (Lanza 2008; Nakanishi 2008; Penumadu 2008; Watkin et al. 2008).
In studying water transport in sand, there are three phases to consider, sand (SiO2), air (N2 and O2), and water (H2O). The total scattering cross sections for thermal neutrons (25 meV) and 40 keV X-rays of H2O, O2, and SiO2 are compared in Fig. 1, and it is seen that the total neutron cross section of H2O is approximately 16 times larger than that of SiO2, whereas for 40 keV X-rays, SiO2 has a cross section six times that of H2O. One of the earliest applications of neutron imaging on soil and rock was performed by Lewis and Krinitzsky with two-dimensional (2D) radiography (Lewis and Krinitzsky 1976). The factor of 16 difference in neutron cross sections between water and silica phases means that there is excellent contrast for water in porous media which has been exploited to study acid etching of limestone and sandstone in the early 1990s (Jasti and Fogler 1992). The instability of a wetting front breaking up into a finger-like flow path in porous media using Ottawa sand was visualized with neutron radiography and tomography (Tullis et al. 1994). A feasibility study to measure the porosity of crystalline rock has been performed (Pleinert and Degueldre 1995). A tomography study of wet sand was performed, though at a low resolution on the order of 1 mm (Lopes et al. 1999). More recently, neutron imaging was also used for the measurement of the water diffusion in brick (Milczarek et al. 2005), two phase flow in porous concrete using a Hassler cell to simulate petroleum recovery (de Beer and Middleton 2006), and water sorption and dehydration with and without salt in three different limestones from the United States (Hassanein et al. 2006).
Fig. 1.
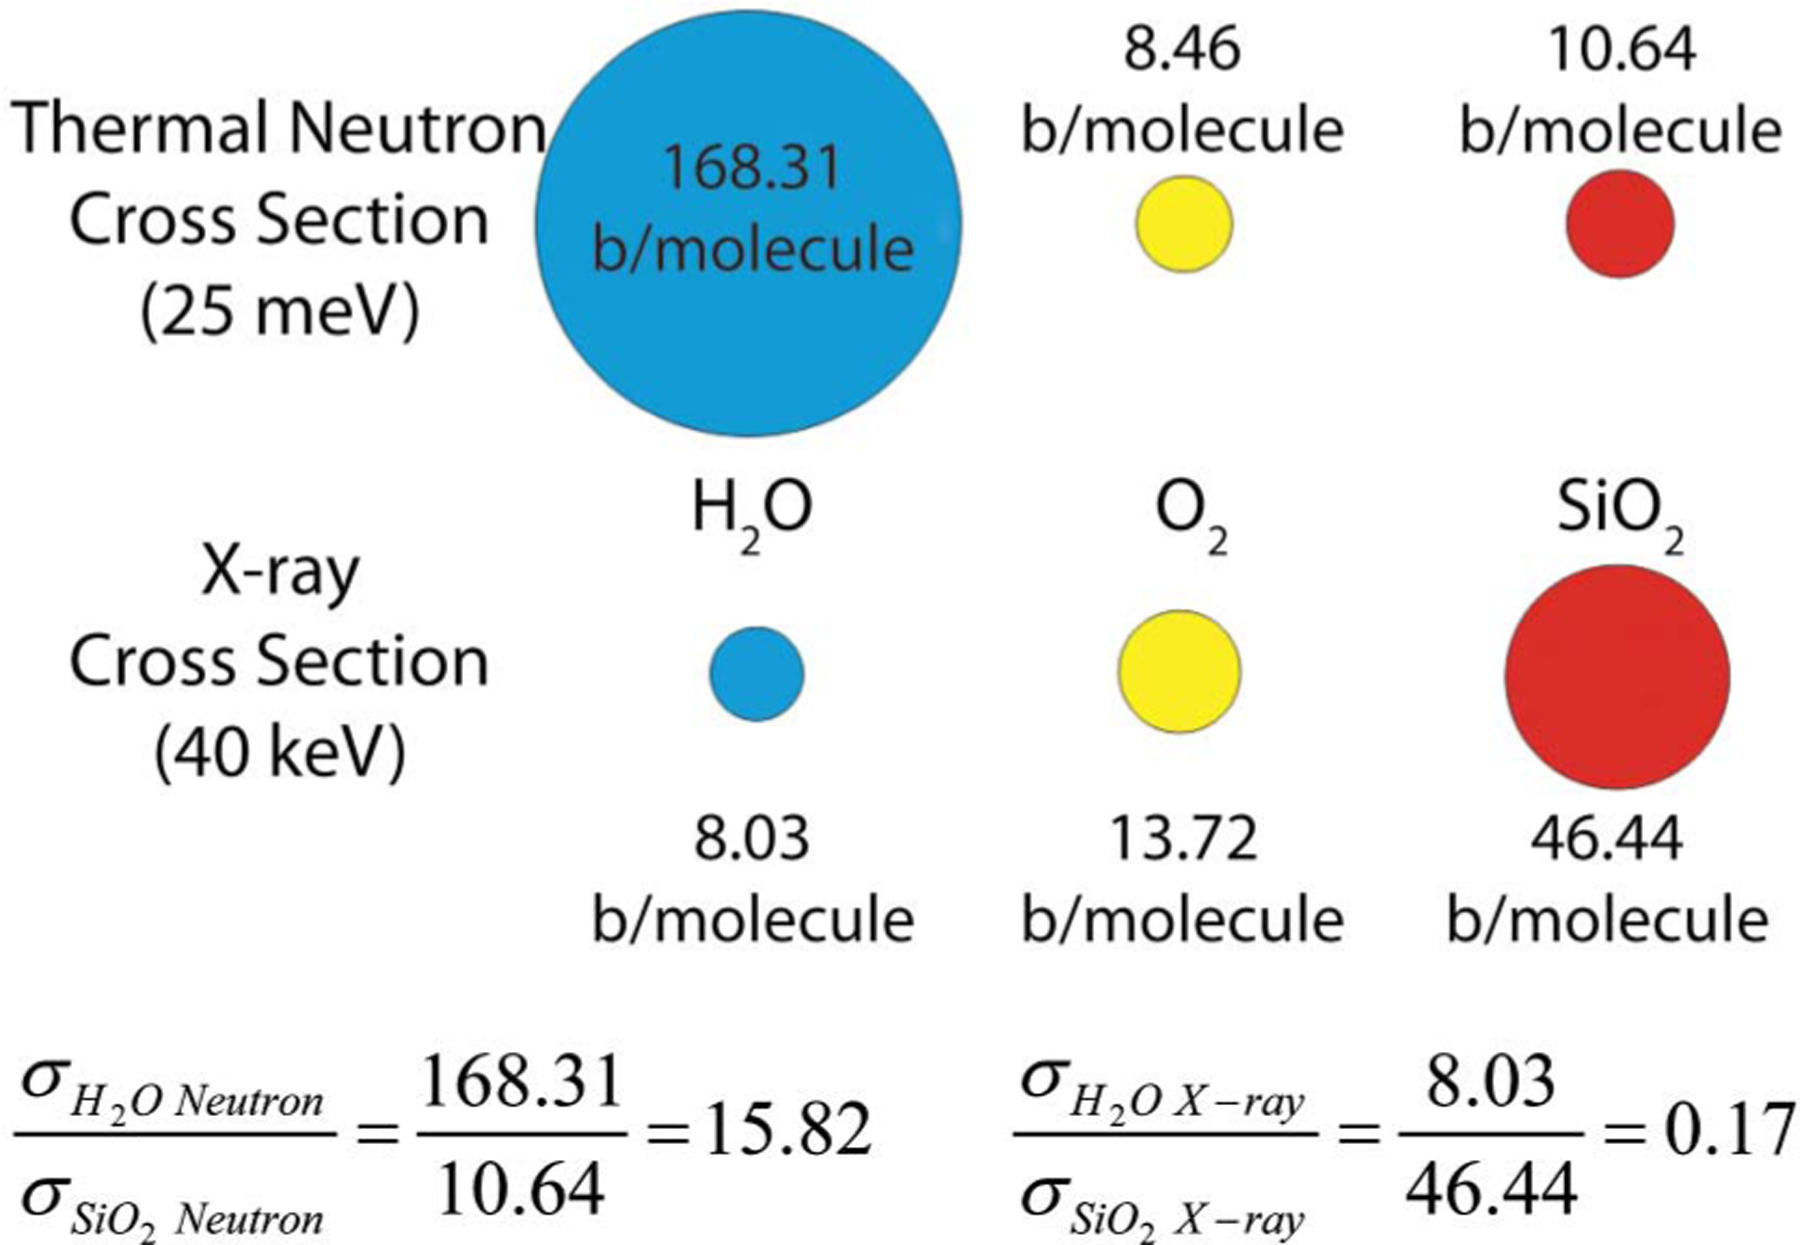
Cross-section comparison of H2O, O2, and SiO2 for neutrons and X-rays (1 b = 10−24 cm2)
In this paper, the water distribution of partially saturated compacted specimens of naturally occurring Ottawa sand and Q-ROK sand was obtained from both 2D neutron radiography and three-dimensional (3D) neutron tomography under static conditions. Although much of the earlier research using neutron imaging has focused on flow through porous media, this study approached the problem of static compacted sand from a soil mechanics point of view. A comparison of the spatial distribution of different water contents is visualized with a contour plot. The effect of particle morphologies on the spatial distribution of water content is also presented using quantitative plots.
Principles of Neutron Imaging
The interaction between a neutron and matter can be described by the total microscopic neutron scattering cross section (σT ) which is an effective collision cross-sectional area. The total microscopic neutron scattering cross section (σT ) comprises both scattering from and absorption by the nucleus. In the case of hydrogen, the scattering cross section is 82.02 b, whereas the absorption cross section is 0.33 b. Thus, the neutron attenuation from hydrogen is primarily attributed to the scattering out of the main beam rather than absorption. A neutron radiograph represents the spatially resolved neutron transmission (T) through a sample, given by Eq. (1), as follows:
| (1) |
where e = 2.718281828;N = number density; and t = material thickness along the beam path. The quantity N · σT is referred to as either the total macroscopic cross section (ΣT ) or the attenuation coefficient (μ). For materials composed of multiple isotopes, ΣT can be calculated by the weighted average. Another approach to determining ΣT is to measure the attenuation in a calibrated wedge. This has been done previously at the National Institute of Standard and Technology (NIST) neutron imaging facility and the amorphous silicon detector for water with Σw = 0.3708 mm−1 (Hussey et al. 2010). The transmission is measured by comparing a reference image (I0) to the image of the sample (I). The reference image can be either the flat field or the sample in a dry state. In the case of the latter, the transmission is a direct measure of the change in water content of the sample. In the case of tomography, the sample is placed on a rotation stage in front of the detector. Several projections (radiographs) are taken as the object is incrementally rotated from 0° to 180°. The filtered back-projection algorithm converts these projections into the 3D distribution of ΣT (Kak and Slaney 2001). Several software packages implement the filtered back-projection algorithm, and the one employed in this work is Octopus version 8.0 (Vlassenbroeck et al. 2007).
Four major components of neutron imaging include a neutron source, an aperture, an object, and a detector, as shown in Fig. 2. At NIST, neutrons are generated from a 20 MW fission reactor. The neutrons are moderated to thermal neutrons in heavy water resulting in a neutron energy spectrum described by a Maxwell-Boltzmann distribution with a characteristic temperature of approximately 37°C which corresponds to a neutron kinetic energy of approximately 25 meV. At this neutron energy range, the neutrons have a reasonable interaction probability for hydrogenous material, high penetration through metals, and most neutron imaging detectors have at least 20% thermal neutron detection efficiency. The moderated neutrons are ballistically transported to an aperture with diameter (D, where D = 10 mm in this work) that defines the beam collimation. The sample is placed at a distance (L) from the aperture (L = 6 m in this work), and the detector is placed directly behind the sample. To reduce scattering in air, an evacuated flight tube is placed between the sample and the aperture. A picture of the sample area at NIST is shown in Fig. 3.
Fig. 2.
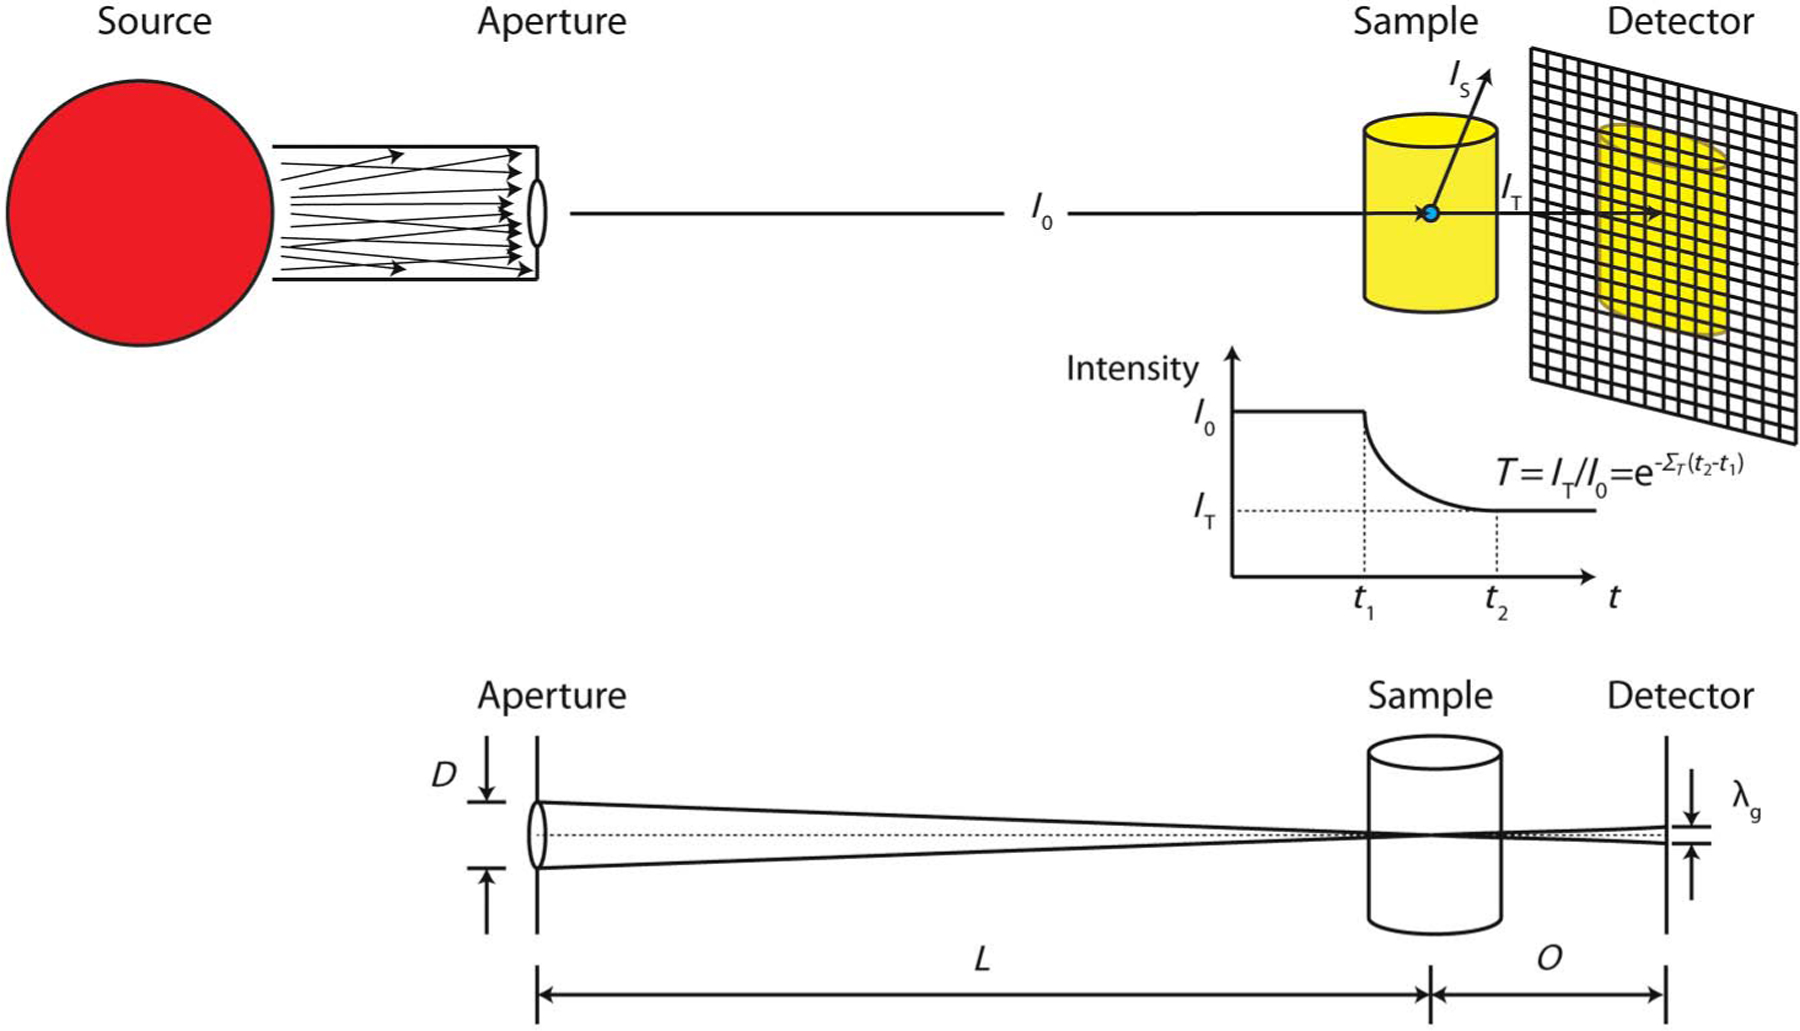
Typical neutron imaging setup; neutron interaction mechanism with matter and the effect of L/D on image resolution
Fig. 3.
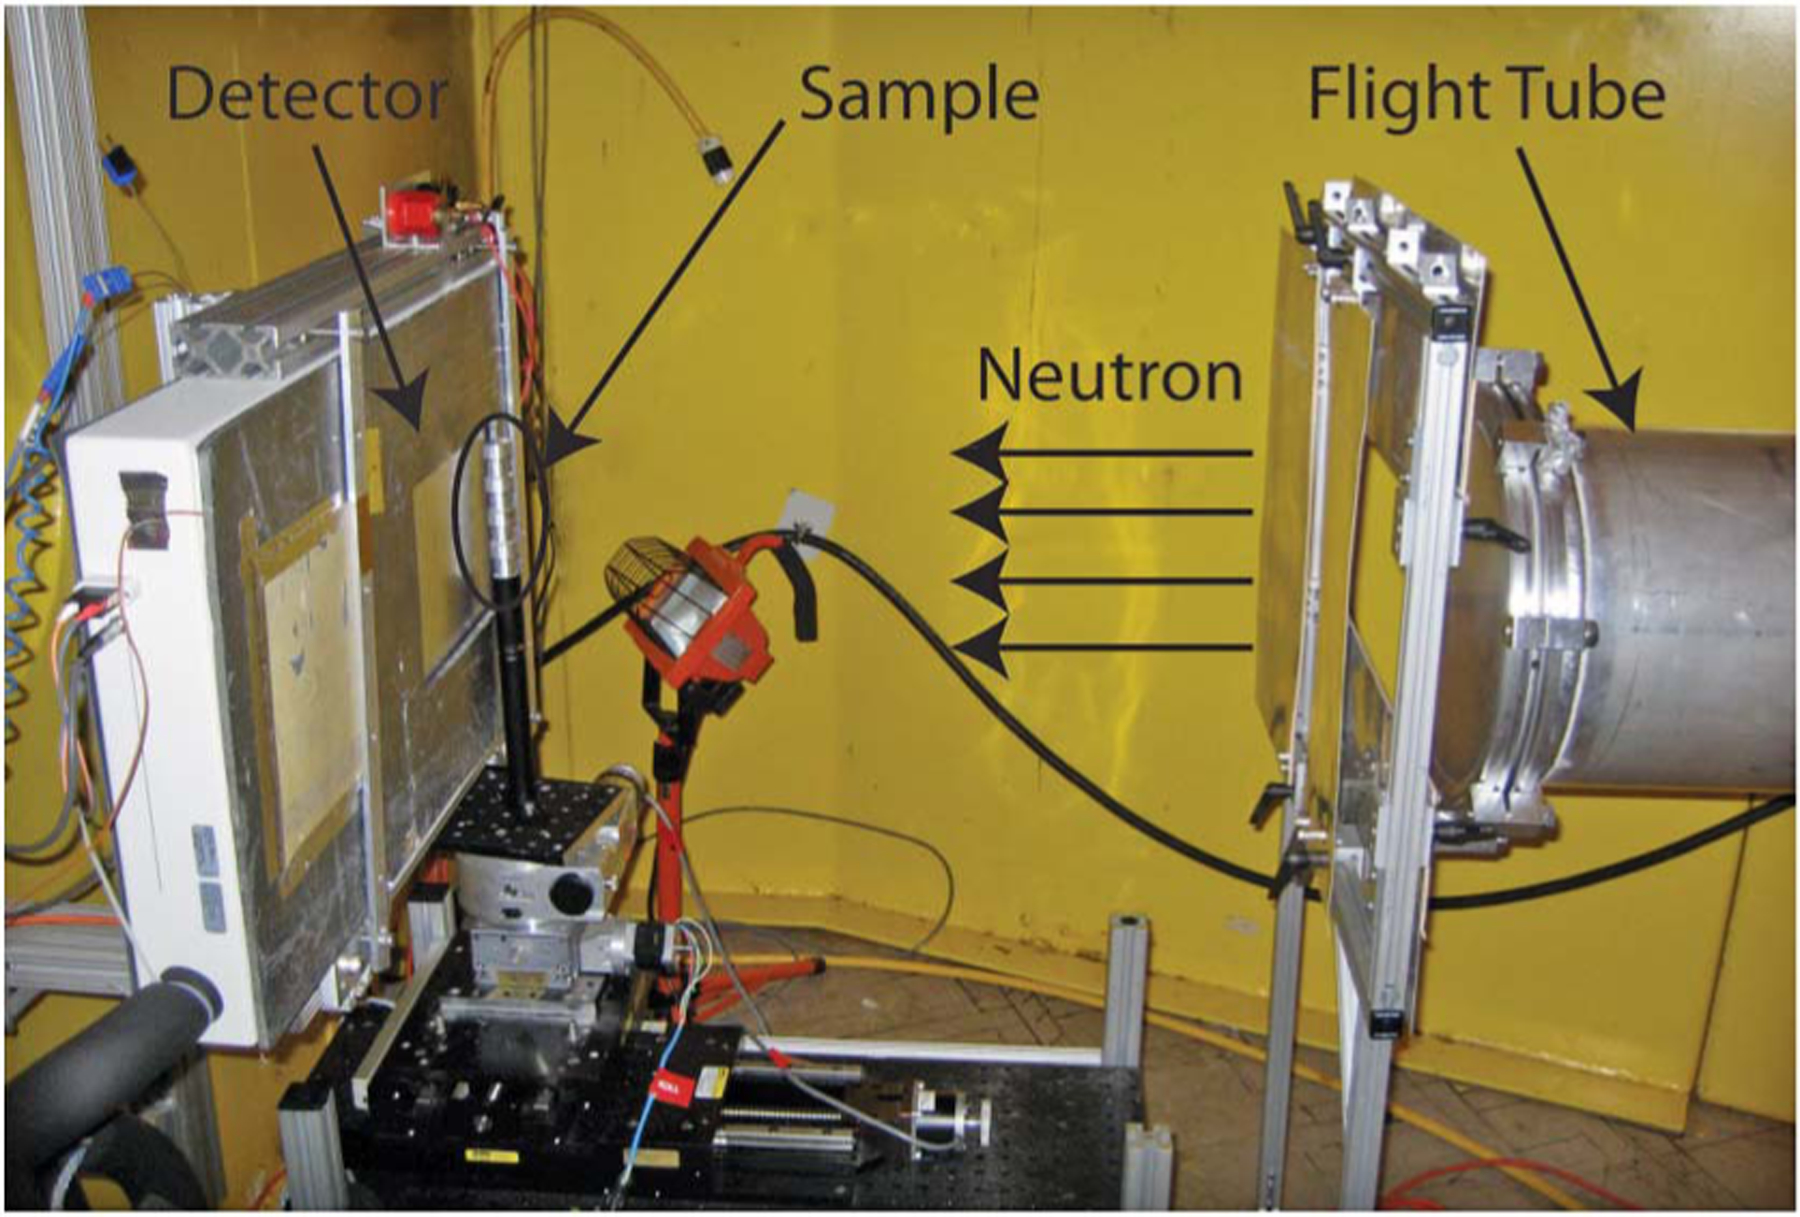
Neutron imaging setup at NIST
The spatial resolution of a neutron imaging system is affected by the geometry of the beam line and the detector resolution. Assuming a linear shift invariant system, the two components can be convolved together to estimate and model the resolution of the system. In theory, the geometry of the beam line is the fundamental limit to the resolution, while in practice the detector resolution has the larger contribution. The geometry of the beam is represented by the collimation ratio L/D which can be found by dividing L by D. For a sample at a distance (O) from the detector, the geometric unsharpness (λg) at full width at half maximum is given by Eq. (2)
| (2) |
Thus, to reduce λg, O is decreased or L/D is increased. However, the neutron fluence rate, which determines the image acquisition time, scales as 1/(L/D)2; thus the geometry must be optimized to achieve the required spatial resolution while maintaining an acceptable image acquisition time. For the images in this work, L/D = 600 with a neutron fluence rate of approximately 4.3× 106 cm−2 s−1 and O = 20 mm, yielding λg = 33.3 μm. The detector resolution is affected by the pixel pitch and the size of the secondary reactions after neutron capture by the converter material. In the case of a scintillator, the largest source of image blur is attributed to the emitted scintillation light. The size of this light “blooming” is approximately the thickness of the scintillator. The detector system used in these experiments was an amorphous silicon detector in direct contact with a zinc sulfide (ZnS) scintillator doped with lithium flouride (LiF) that is 300 μm thick. The amorphous silicon detector has a 127 μm pixel pitch with a frame rate ranging from 1 Hz to 10 Hz. The spatial resolution [based on the point at which the modulation (edge) transfer function reaches 10% of its maximum] of this detector system is approximately 250 μm (127-μm pixel size) (Hussey et al. 2010). The field of view of the detector is 20 cm by 25 cm, which enabled the simultaneous acquisition of the tomography data sets for four specimens, as shown in Fig. 4. The 127-μm pixel size enabled faster acquisition of several specimens by reducing both the individual acquisition time and the number of projections required for computed tomography reconstruction.
Fig. 4.
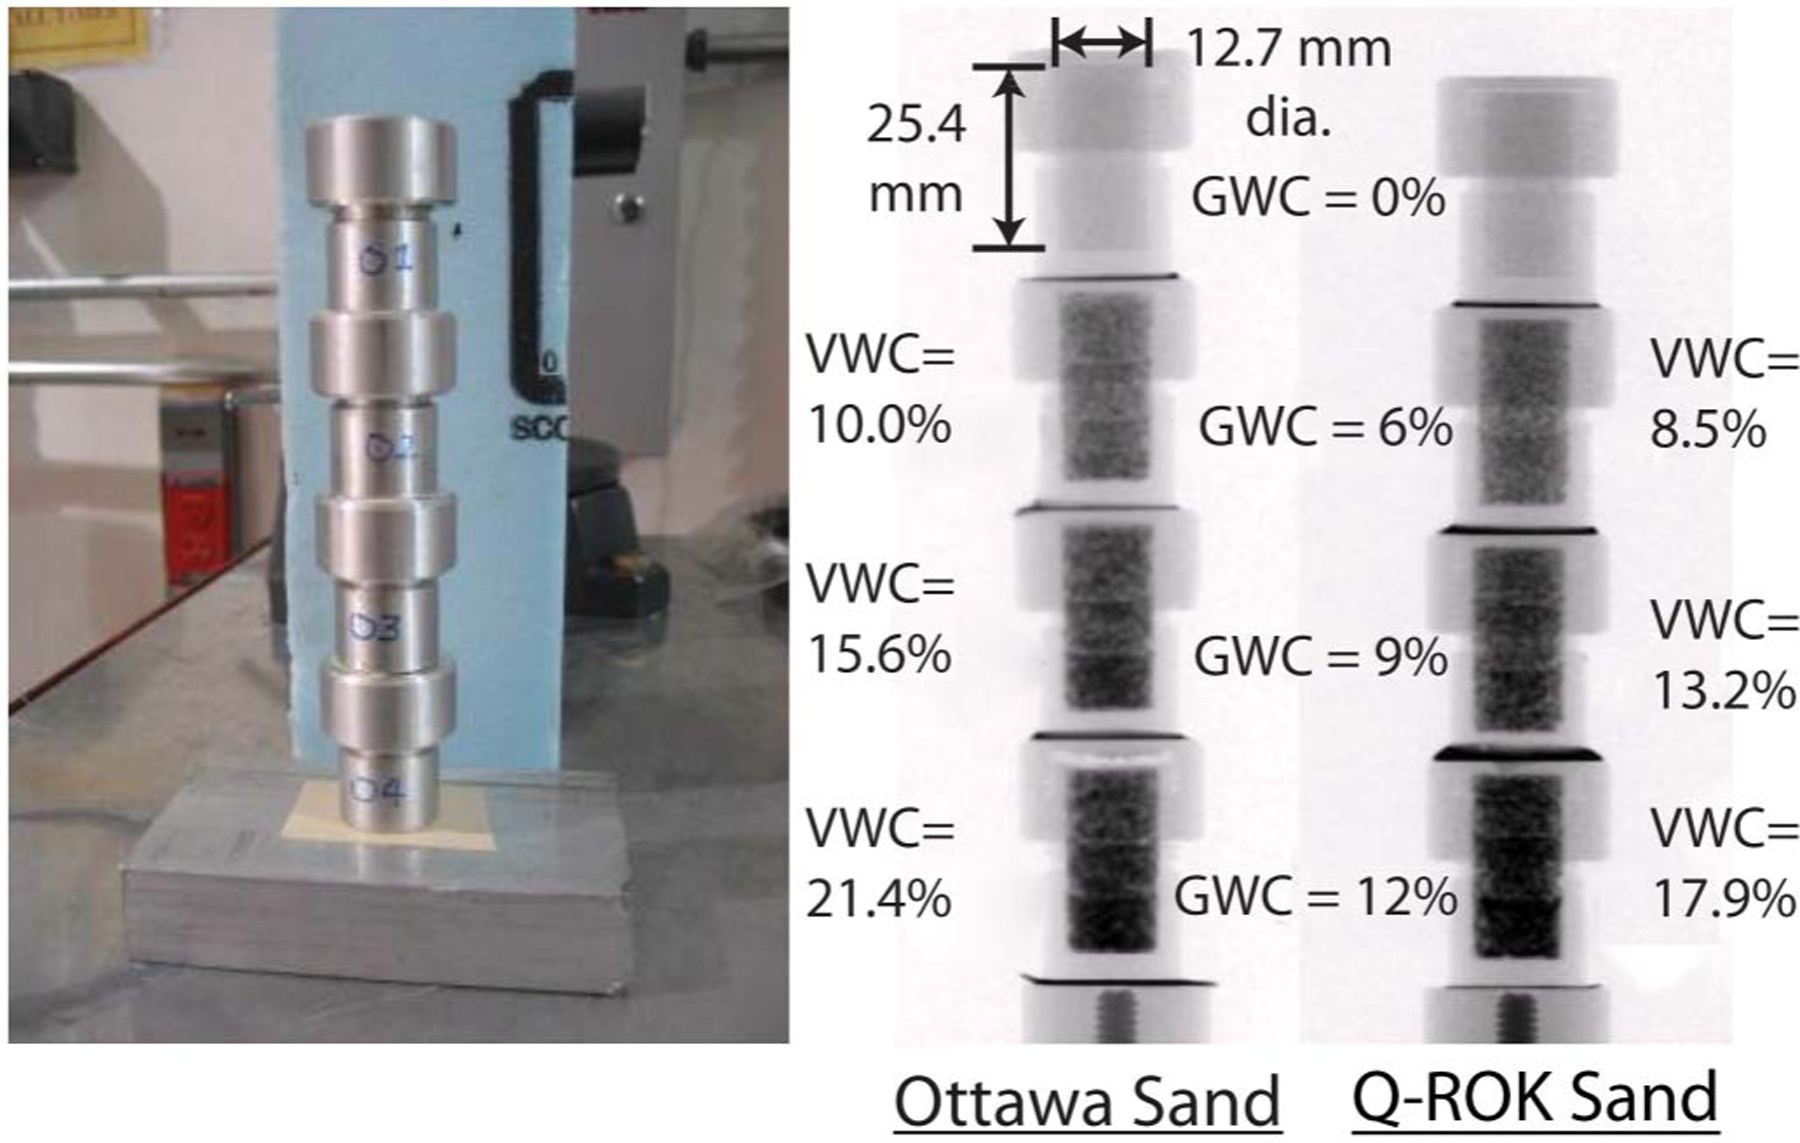
Picture of sand specimens contained in aluminum specimen holders and radiographs of Ottawa sand and Q-ROK sand
It has been established recently that quantification of the water content in samples with thick sections of water can be affected by the scattered neutrons (Hassanein et al. 2005). A fundamental assumption for neutron imaging is that the image is formed by the neutrons attenuated by the sample. In reality, there are some neutrons that are scattered by the sample and can reach the detector. The effect of these scattered neutrons on image formation was demonstrated to be significant for a relatively thick sample containing elements such as hydrogen in the order of several centimeters thicknesses (Hassanein et al. 2005). The effect of sample scattering also decreases as the sample to detector distance increases. In this work, the total thickness of water along the neutron beam path is less than 1 mm, and as shown in the Appendix, the scattering effect in this case is negligible.
Sample Description
Two different sands were used to compare the effect of particle morphology on water content: Ottawa sand (spherical) and Q-ROK sand (angular). The morphologies are shown in Fig. 5 with scanning electron microscopy (SEM) images (Penumadu et al. 2009). The sands were obtained from U.S. Silica, Berkeley Springs, West Virginia, having mineralogy with approximately 99.8% SiO2 for Ottawa sand (20/40 oil frac) and 99.7% SiO2 for #1 Q-ROK sand. The specific gravity of both sands is 2.65. The grain size distributions for both sand types are shown in Fig. 6. Four specimens were prepared for each sand morphology (Ottawa sand and Q-ROK sand) by adding an amount of water (0, 0.36, 0.54, and 0.72 g) to 6 g of dry sand, yielding four different gravimetric water contents (GWC): 0%, 6%, 9%, and 12%, respectively. The water contents were chosen on the basis of the typical water content in the field. The specimen containers were aluminum cylinders with an inner diameter of 12.7 mm and a height of 25.4 mm. After mixing the dry sand with water, the moist sand was split into three approximately equal amounts and compacted in three layers using an equal amount of tamping energy by dropping an aluminum rod with a mass of 71.12 g from an approximate height of 10 mm. Depending on the morphology and water content, each specimen has a different mass of sand placed in the container. On the basis of the mass of wet sand and its gravimetric water content, the volumetric water content (VWC) of each specimen was obtained assuming that the sand was homogenously mixed, as shown in Table 1. The estimated void ratios of each specimen are also shown in Table 1. Radiographs of the specimens are shown in Fig. 4. Approximately 24 h of equilibration time was allowed before acquiring the radiography and tomography data sets. Tomography experiments were performed with 360 projections for 180° of total rotation with a 0.5° increment. Ten images were taken at each projection for 1-s exposure time, and they were averaged to improve the signal to noise ratio. Additional experimental parameters are shown in Table 2.
Fig. 5.
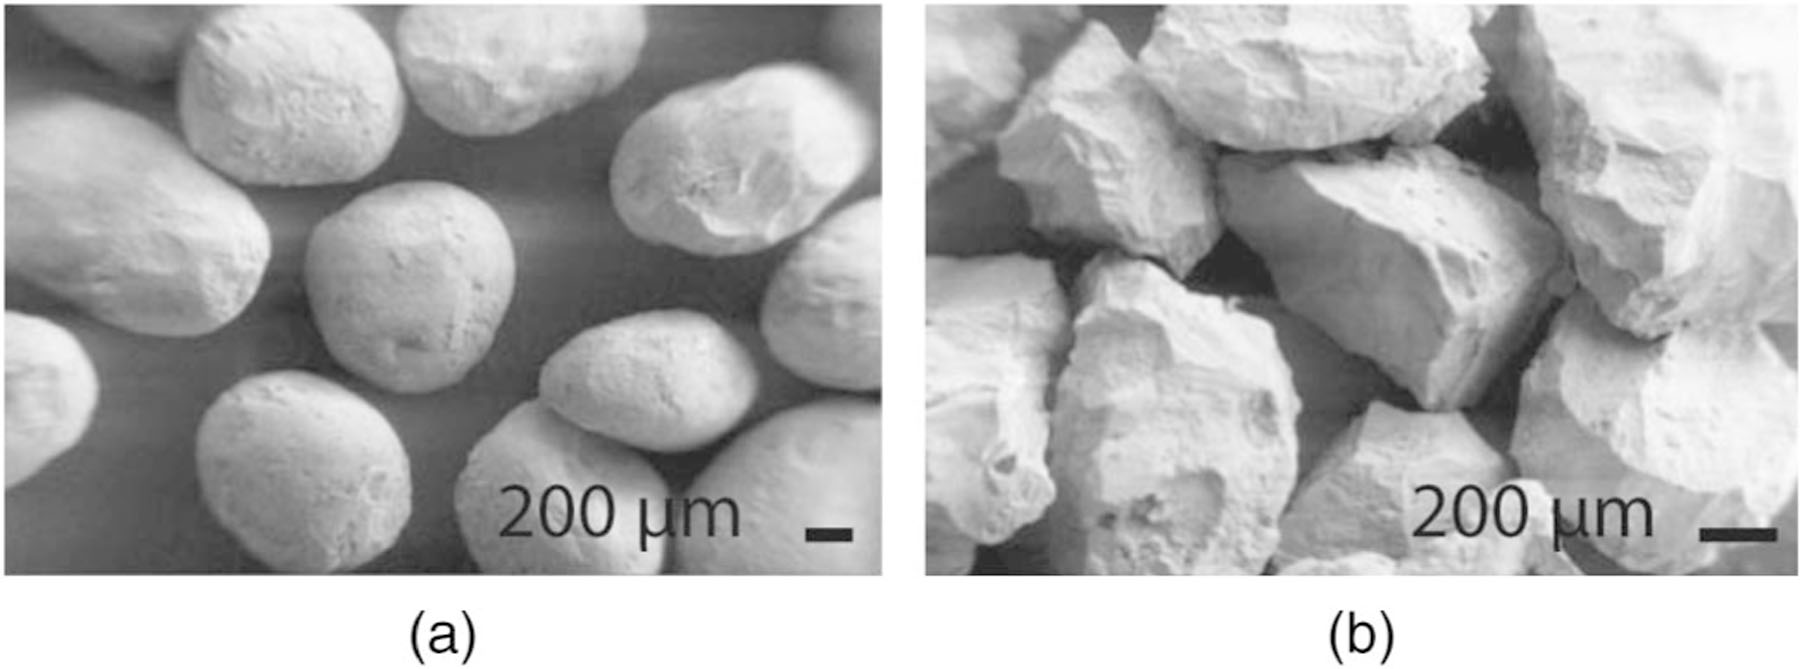
Morphology comparison of: (a) Ottawa sand; and (b) Q-ROK sand
Fig. 6.
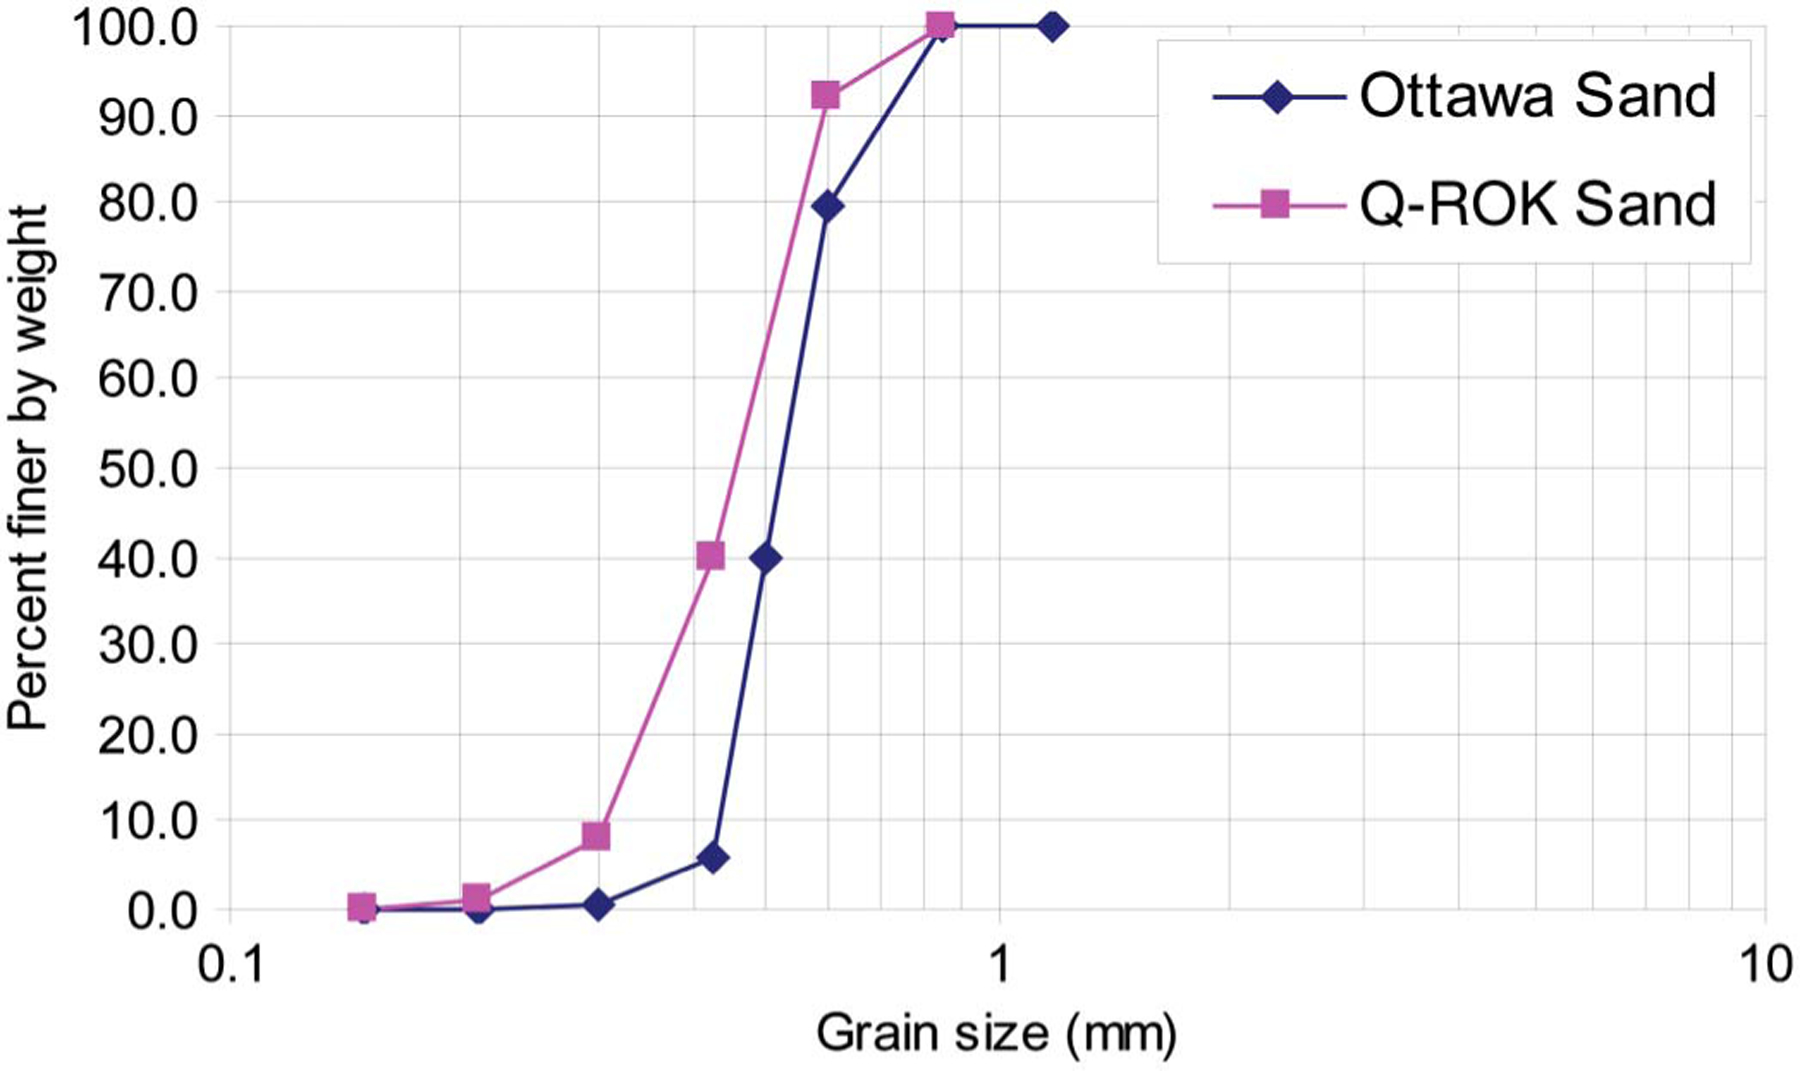
Grain size distribution of Ottawa sand and Q-ROK sand
Table 1.
Gravimetric Water Content (GWC), Volumetric Water Content (VWC), Total Mass (mT ) and Void Ratio (e) for Each Sand Specimen
| Sand type | GWC (%) | 6 | 9 | 12 |
|---|---|---|---|---|
| Ottawa sand | mT (g) | 5.38 | 5.57 | 5.74 |
| VWC (%) | 10 | 15.6 | 21.4 | |
| e | 0.686 | 0.682 | 0.688 | |
| Q-ROK sand | mT (g) | 4.57 | 4.72 | 4.79 |
| VWC (%) | 8.5 | 13.2 | 17.9 | |
| e | 0.985 | 0.985 | 1.023 |
Table 2.
Neutron Imaging Experimental Parameters
| Experimental parameters | Value |
|---|---|
| L | 6 m |
| D | 10 mm |
| L/D | 600 |
| Fluence rate | 4.3 × 106 cm−2 s−1 |
| Average diameter of sand | 800 μm |
| Neutron energy range | Thermal (25 meV) |
| Spatial resolution | 250 μm (127 μm/pixel) |
| Number of projections | 360 |
| Exposure time | 10 s/projection |
Water Distribution Variation of Partially Saturated Sand
The dry sand and three wet sands with different gravimetric water contents are used for analysis. The dry sand image is formed from the attenuation of neutrons through sand and air. The wet sand image is a result of the sum of attenuations associated with water, sand, and air. The intensity of pixels corresponding to wet sand (IWetSand) and dry sand (ISand) can be represented using Eqs. (3) and (4), respectively. The macroscopic cross sections of water and dry sand are denoted as Σw and Σs, respectively. The thicknesses of water and sand layers in the neutron ray path are denoted as tw and ts. The intensity of pixels at a given spatial location (x; y) in the two-dimensional image corresponding to wet sand (IWetSand) and dry sand (ISand) can be represented using Eqs. (3) and (4), respectively.
| (3) |
| (4) |
The image of wet sand is divided by the image of dry sand, as shown in Fig. 7 to isolate the attenuation resulting from water only. An assumption is made that the mode of sand compaction was the same for each specimen of the same sand regardless of the water content. In reality, there is liquid between grains at the point of contact, and the mode of compaction of wet sand is different from that of dry sand because of pore pressure. Line plots of sand specimens with different GWC are shown in Fig. 8. It is shown that the attenuation of dry sand is comparably lower than that of water. The dominant phase for neutrons in the granular system is the water. Thus, the error resulting from differences in sand compaction is negligible.
Fig. 7.
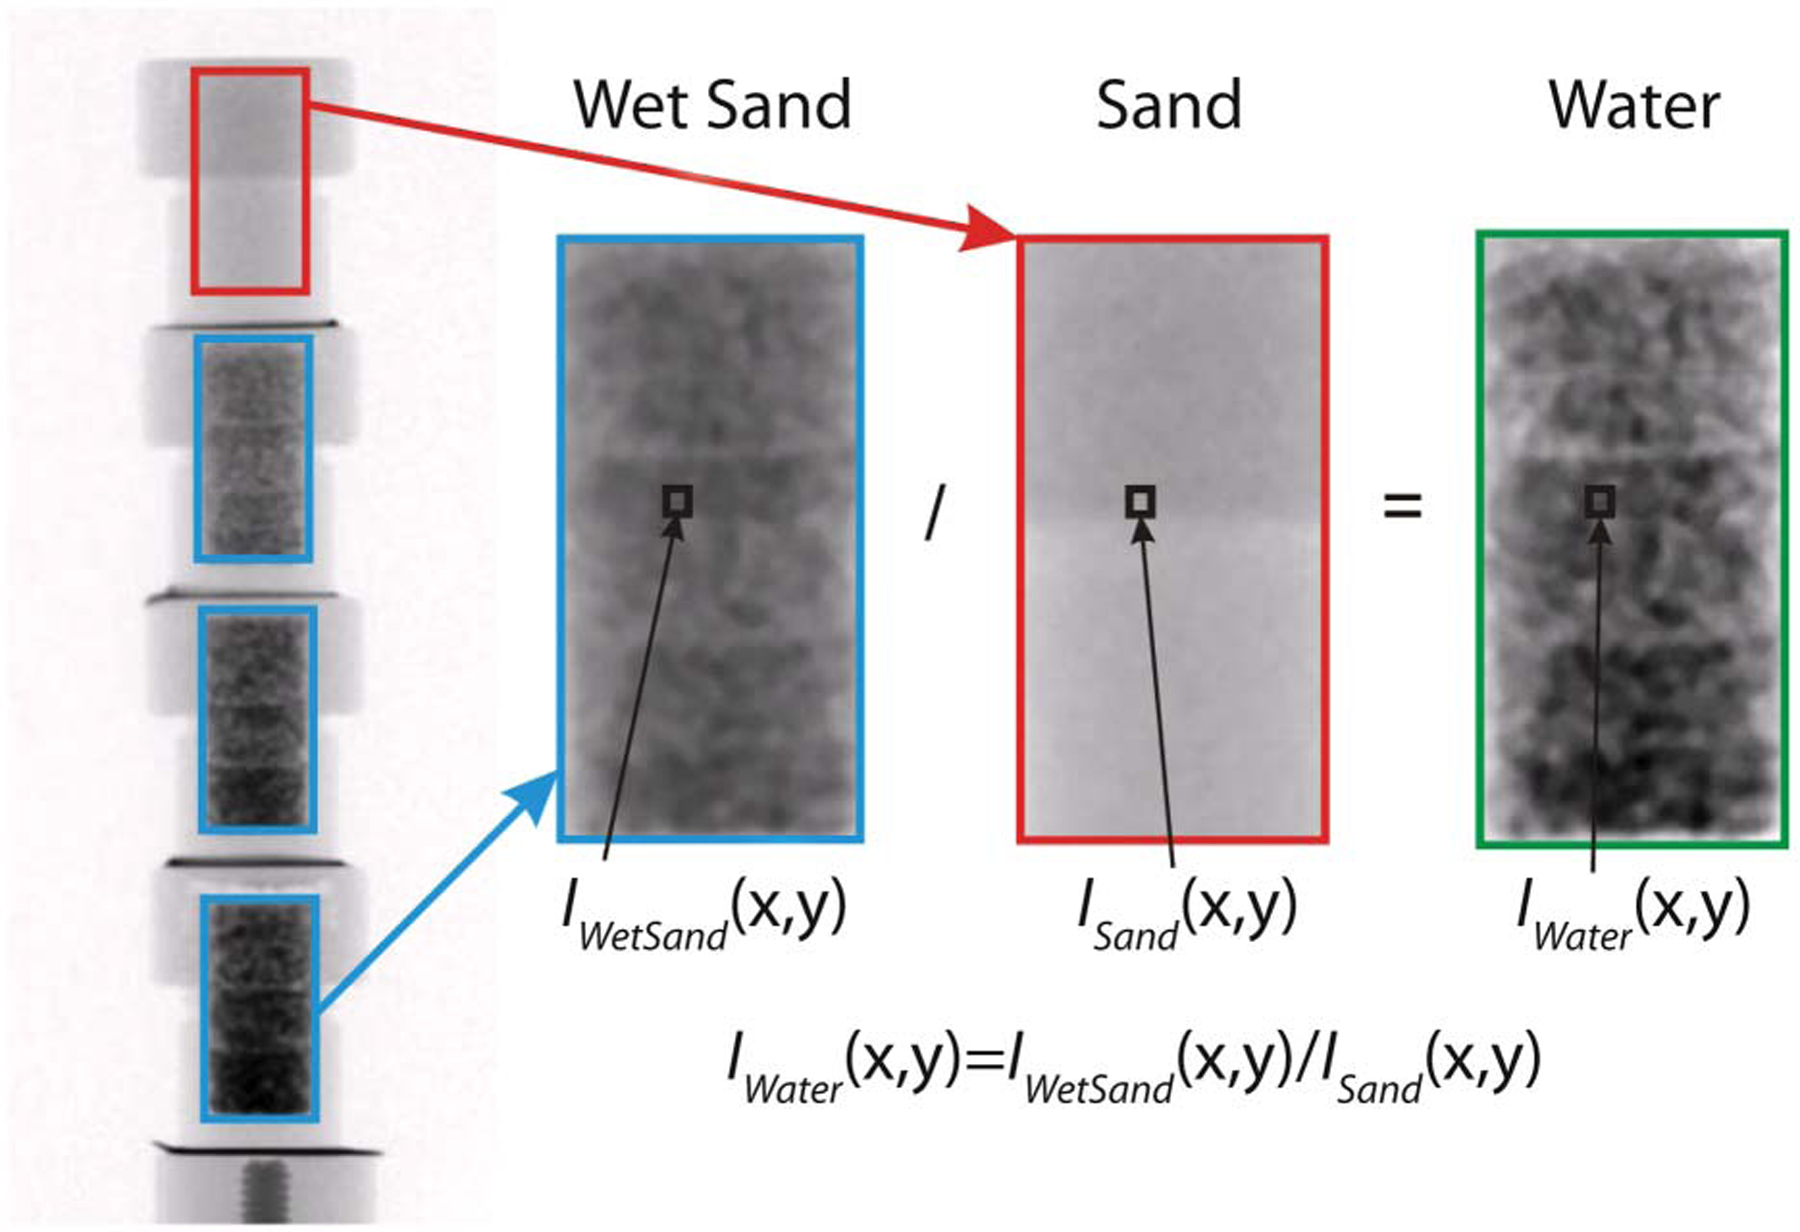
Image division process
Fig. 8.
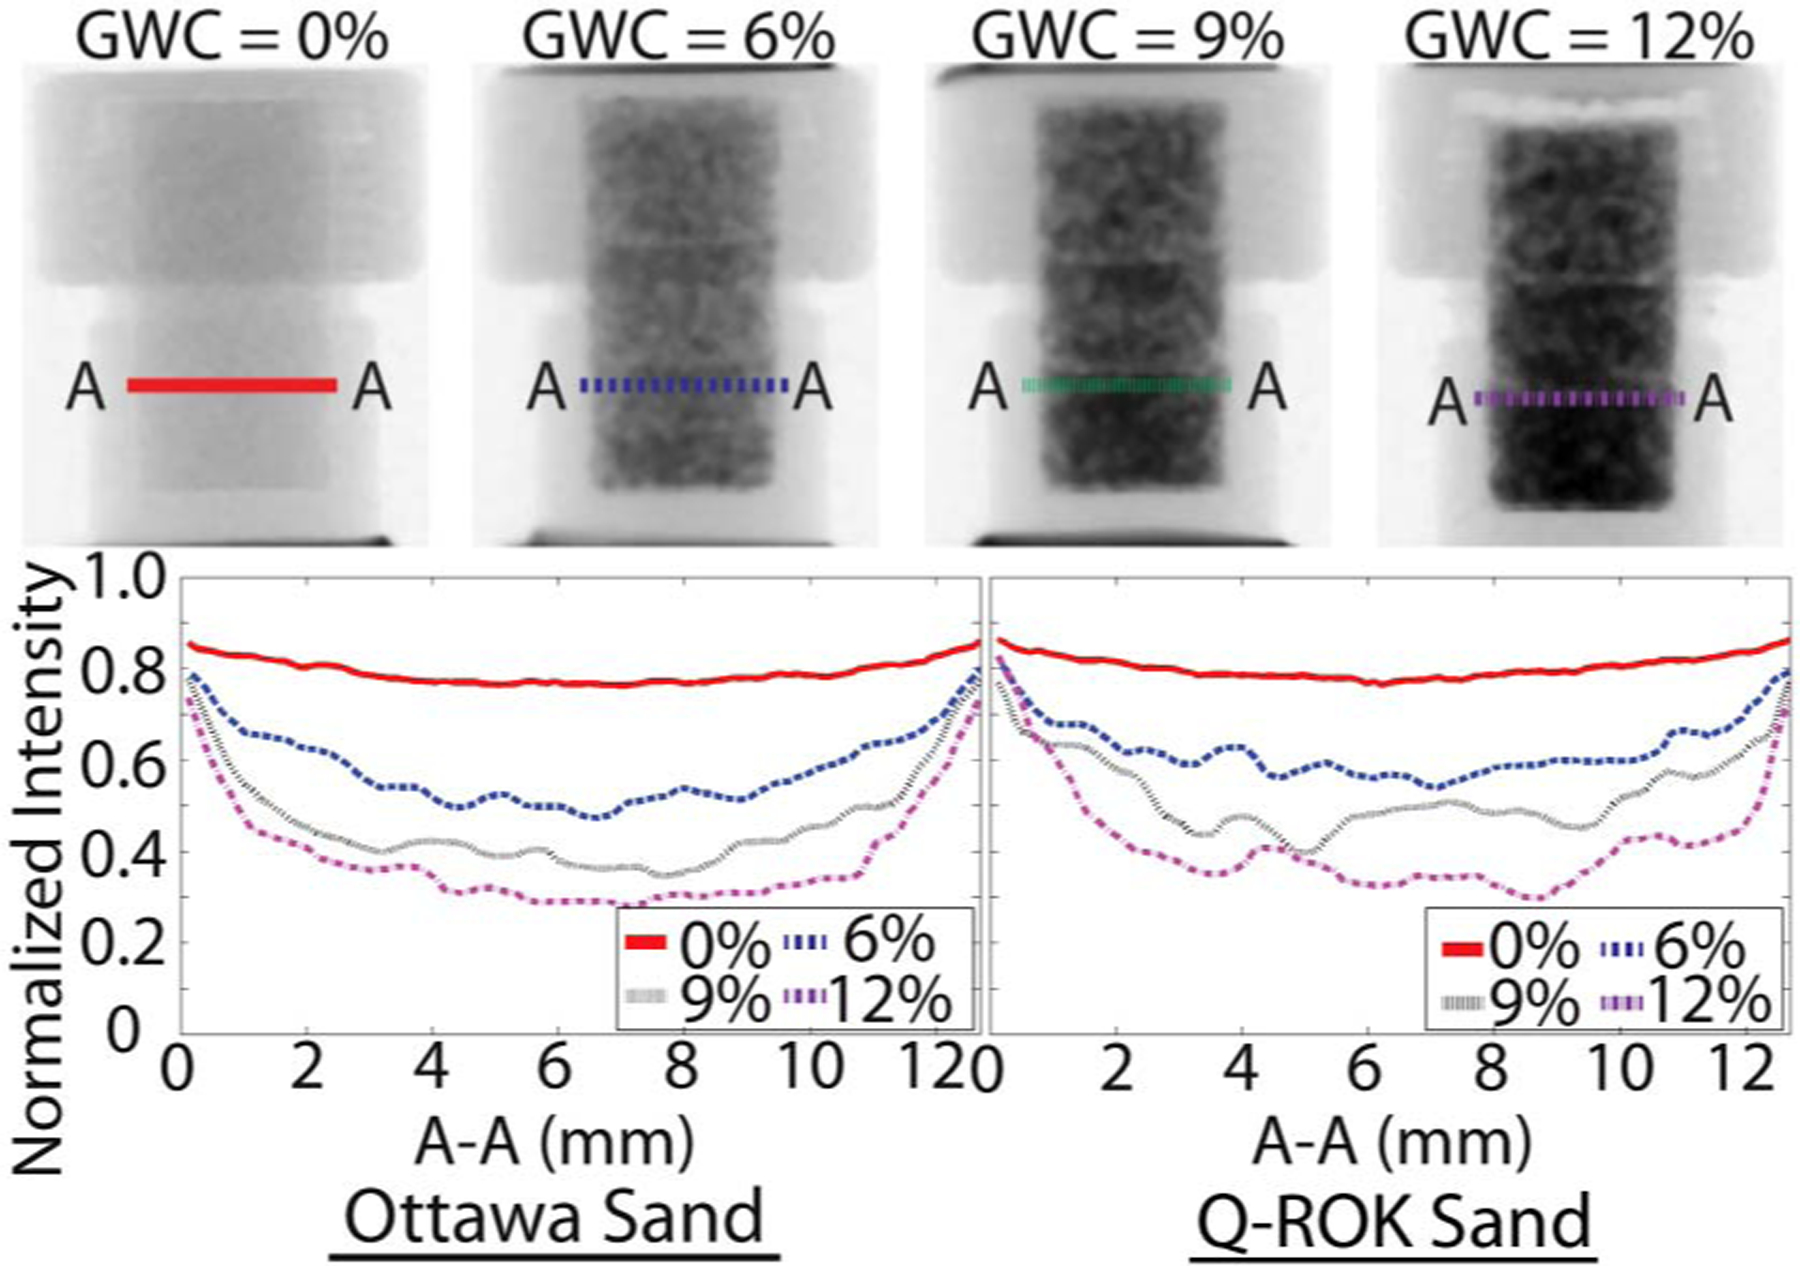
Attenuation comparison of line A-A for 0%, 6%, 9%, and 12% gravimetric water content (GWC) Ottawa sand and Q-ROK sand
A radiography image of water distribution is typically used to measure the 2D water distribution in flow experiments. By normalizing a wet image with a dry reference image, the 2D distribution of the water thickness (tw) can be directly obtained from Eq. (5)
| (5) |
By dividing the total water thickness (tw) by the total container interior thickness (tc) at each pixel, the water content (WC) at each pixel can be simply calculated from Eq. (6)
| (6) |
The WC distributions of both Ottawa sand (round particle shape) and Q-ROK sand (angular particle shape) are shown in Fig. 9. The amount of water found along the height of the porous media increased with depth and could be the result of the compaction process coupled with gravity. For example, the sand specimen was prepared using three layers, which were each subjected to a similar amount of compaction energy from the tamping rod. This resulted in the largest compaction energy for the bottom layer. The interfaces of the three layers of compaction are clearly visible with significant variation in local water content. In addition to the compaction layers, the morphology and packing density also introduce variations in the local WC. For example, 12% GWC sand has 21.4% VWC, and 12% GWC Q-ROK sand has 17.9% VWC. For the 21.4% VWC Ottawa sand specimen, the local WC varied approximately from 5% to 28%, and for the 17.9% VWC Q-ROK sand specimen, the local WC was distributed approximately from 5% to 25%. The large variation of local WC indicates that the current practice of measuring global water content does not consider the rather complex geometry of water content distribution. There is some possible error of the WC values at the boundaries of the images because of the manual selection process of image areas and a slight difference in the size of the actual sample area during the aluminum container fabrication process, but the WC values in the interior of the image should correspond to Eq. (6), because this region averages over many sand particles.
Fig. 9.
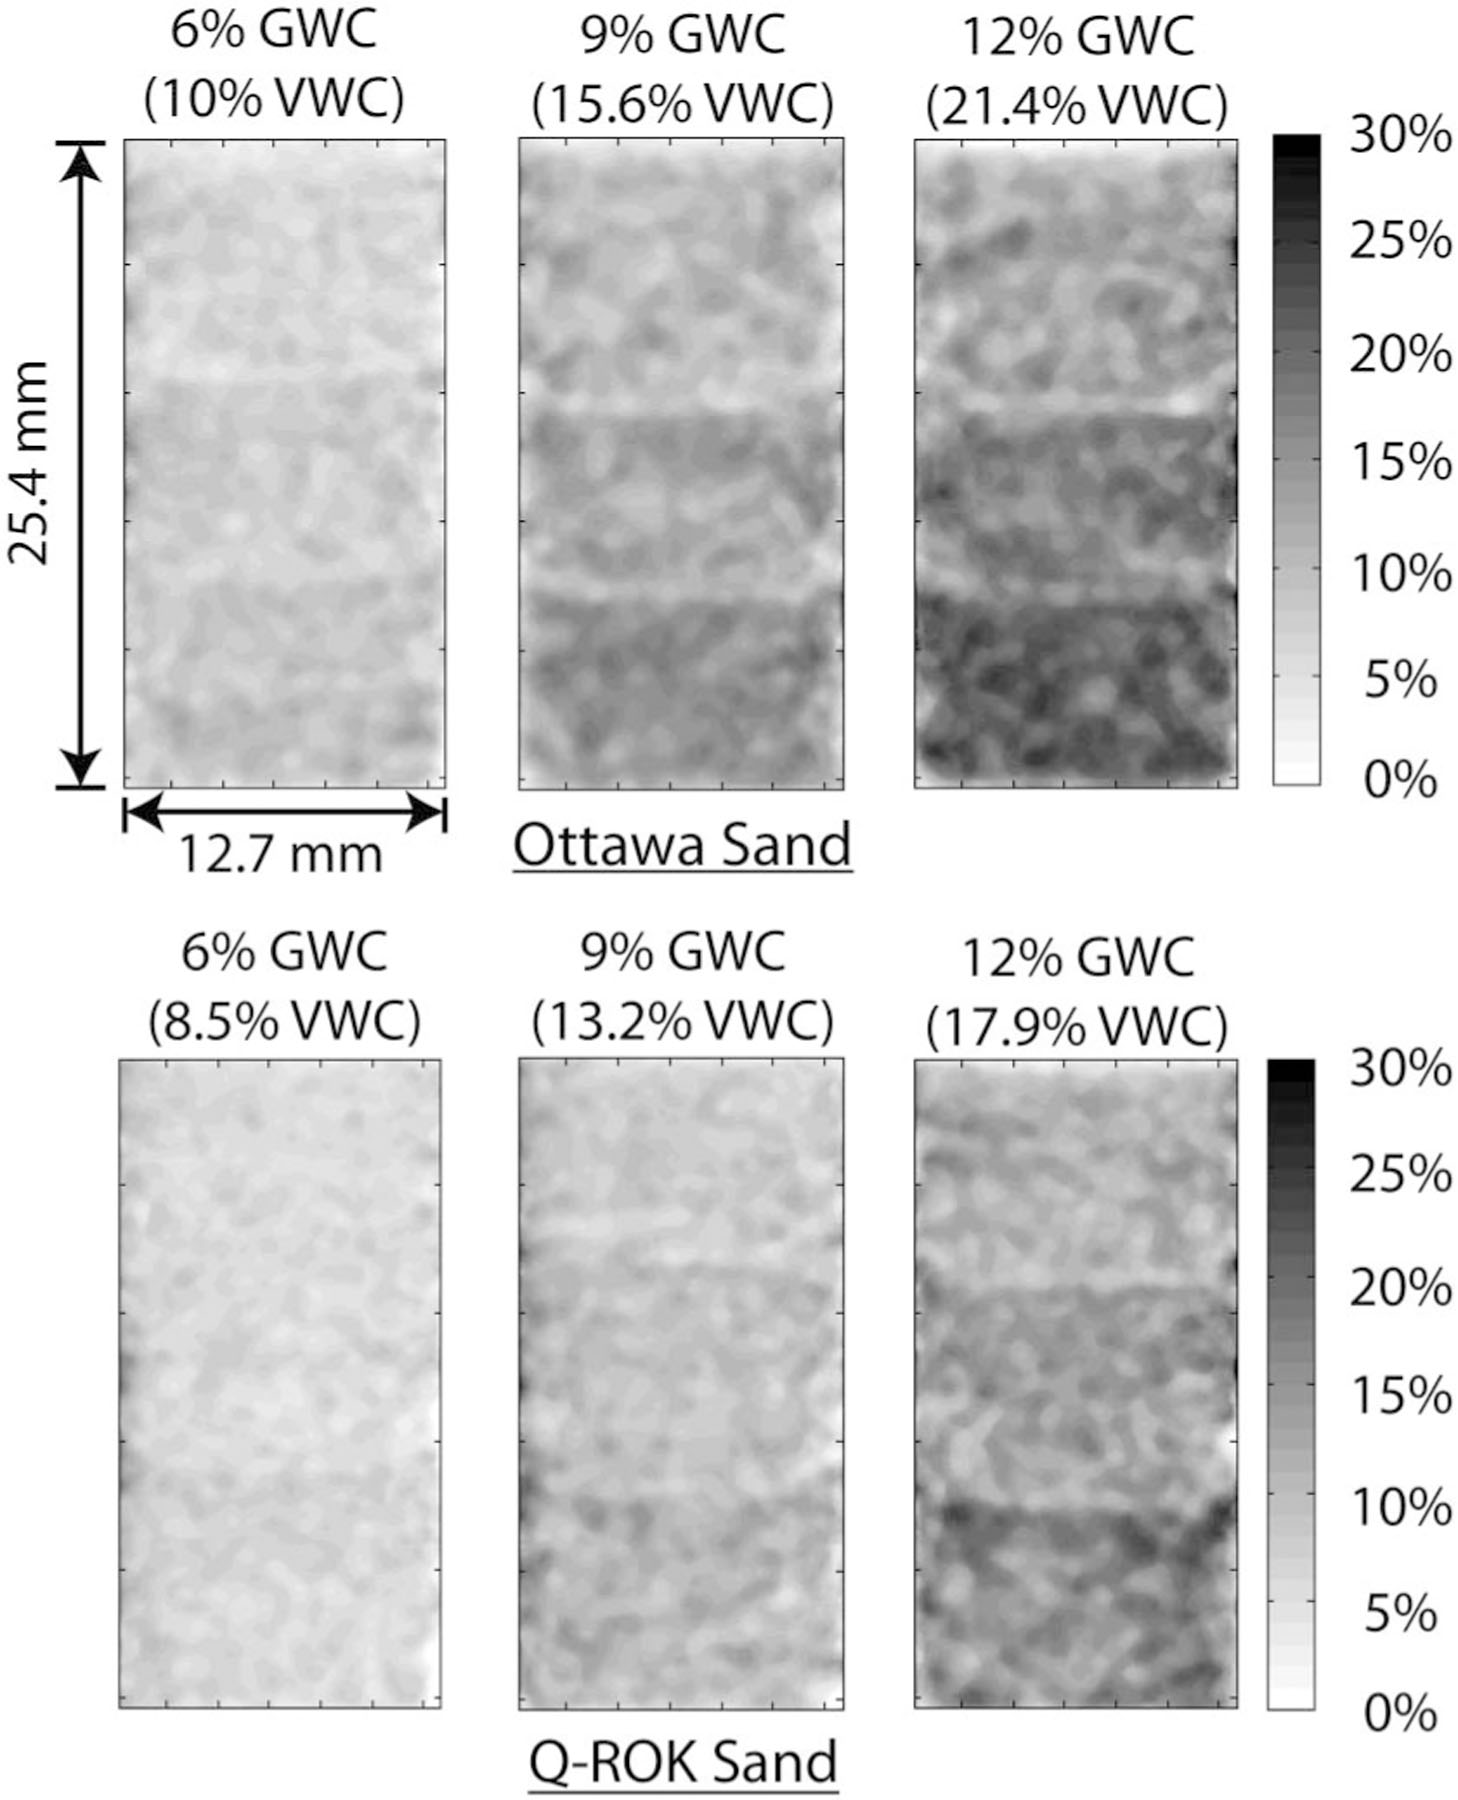
Contour plots of water content (WC) distribution from neutron radiography images: (top) Ottawa sand; and (bottom) Q-ROK sand
In the reconstructed tomography slices, water distribution analysis is performed for both Ottawa sand and Q-ROK sand. To approximate the water saturation (WS) at a voxel location (x; y; z), Eq. ((7)) is used as follows:
| (7) |
The macroscopic cross-section value on each pixel of the reconstructed slice is denoted as Σrecon and is the combination of attenuation values of the volumetric percentages of water, sand, and air. Since the total macroscopic cross section of water is 20 and 104 times larger than that of sand and air, respectively, Eq. (7), at most, is discrepant by approximately 5%; thus it is a good approximation for the WS.
The effect of particle shape on water distribution was studied by comparing reconstructed slices of Ottawa sand and Q-ROK sand. The reconstructed slices at the interface between the bottom and middle compaction layers of each sand specimen were used for comparison. It can be visually inspected that the water spatial distribution of Q-ROK sand is less uniform than that of Ottawa sand, as shown in Fig. 10. The standard deviations of pixel intensity histogram of tomograms were evaluated for each specimen with different global GWC as shown in Fig. 11. It is shown that the standard deviation of Q-ROK sand is higher than that of Ottawa sand despite the lower VWC of Q-ROK sand. The standard deviation also increases as the GWC increases. The water distribution is more homogeneous for Ottawa sand than for Q-ROK sand. The water saturation variation increases as the global GWC increases. There are many voids not filled with water between groups of sand grains in Q-ROK sand. For 12% GWC (21.4% VWC) Ottawa sand, the local WS was anywhere from 25% to 55%. For 12% GWC (17.9% VWC) Q-ROK sand, the local WS ranged from 20% to 50%. The water saturation did not reach 100% because ofthe partially saturated state of specimen and the partial voxel effect. As the global water content increases, the maximum WS value increases, as shown in Fig. 10. It is inferred that the volume of the water capillary films and bridges increases as the global water content increases. It was also observed from other research work that the volume of capillary bridges increase as the water content increases based on experiments using optical microscopy (Kohonen et al. 2004). The 100% WS value can be reached when the pore is fully filled with water. The imaging system also needs to have a resolution much smaller than the pore size. A comparison between the interfaces of each compaction layer is shown in Fig. 12. Higher WS values and more uniform distribution are observed from the top to the bottom layer as the lower layer received more compaction energy in addition to gravity effect than the higher layer.
Fig. 10.
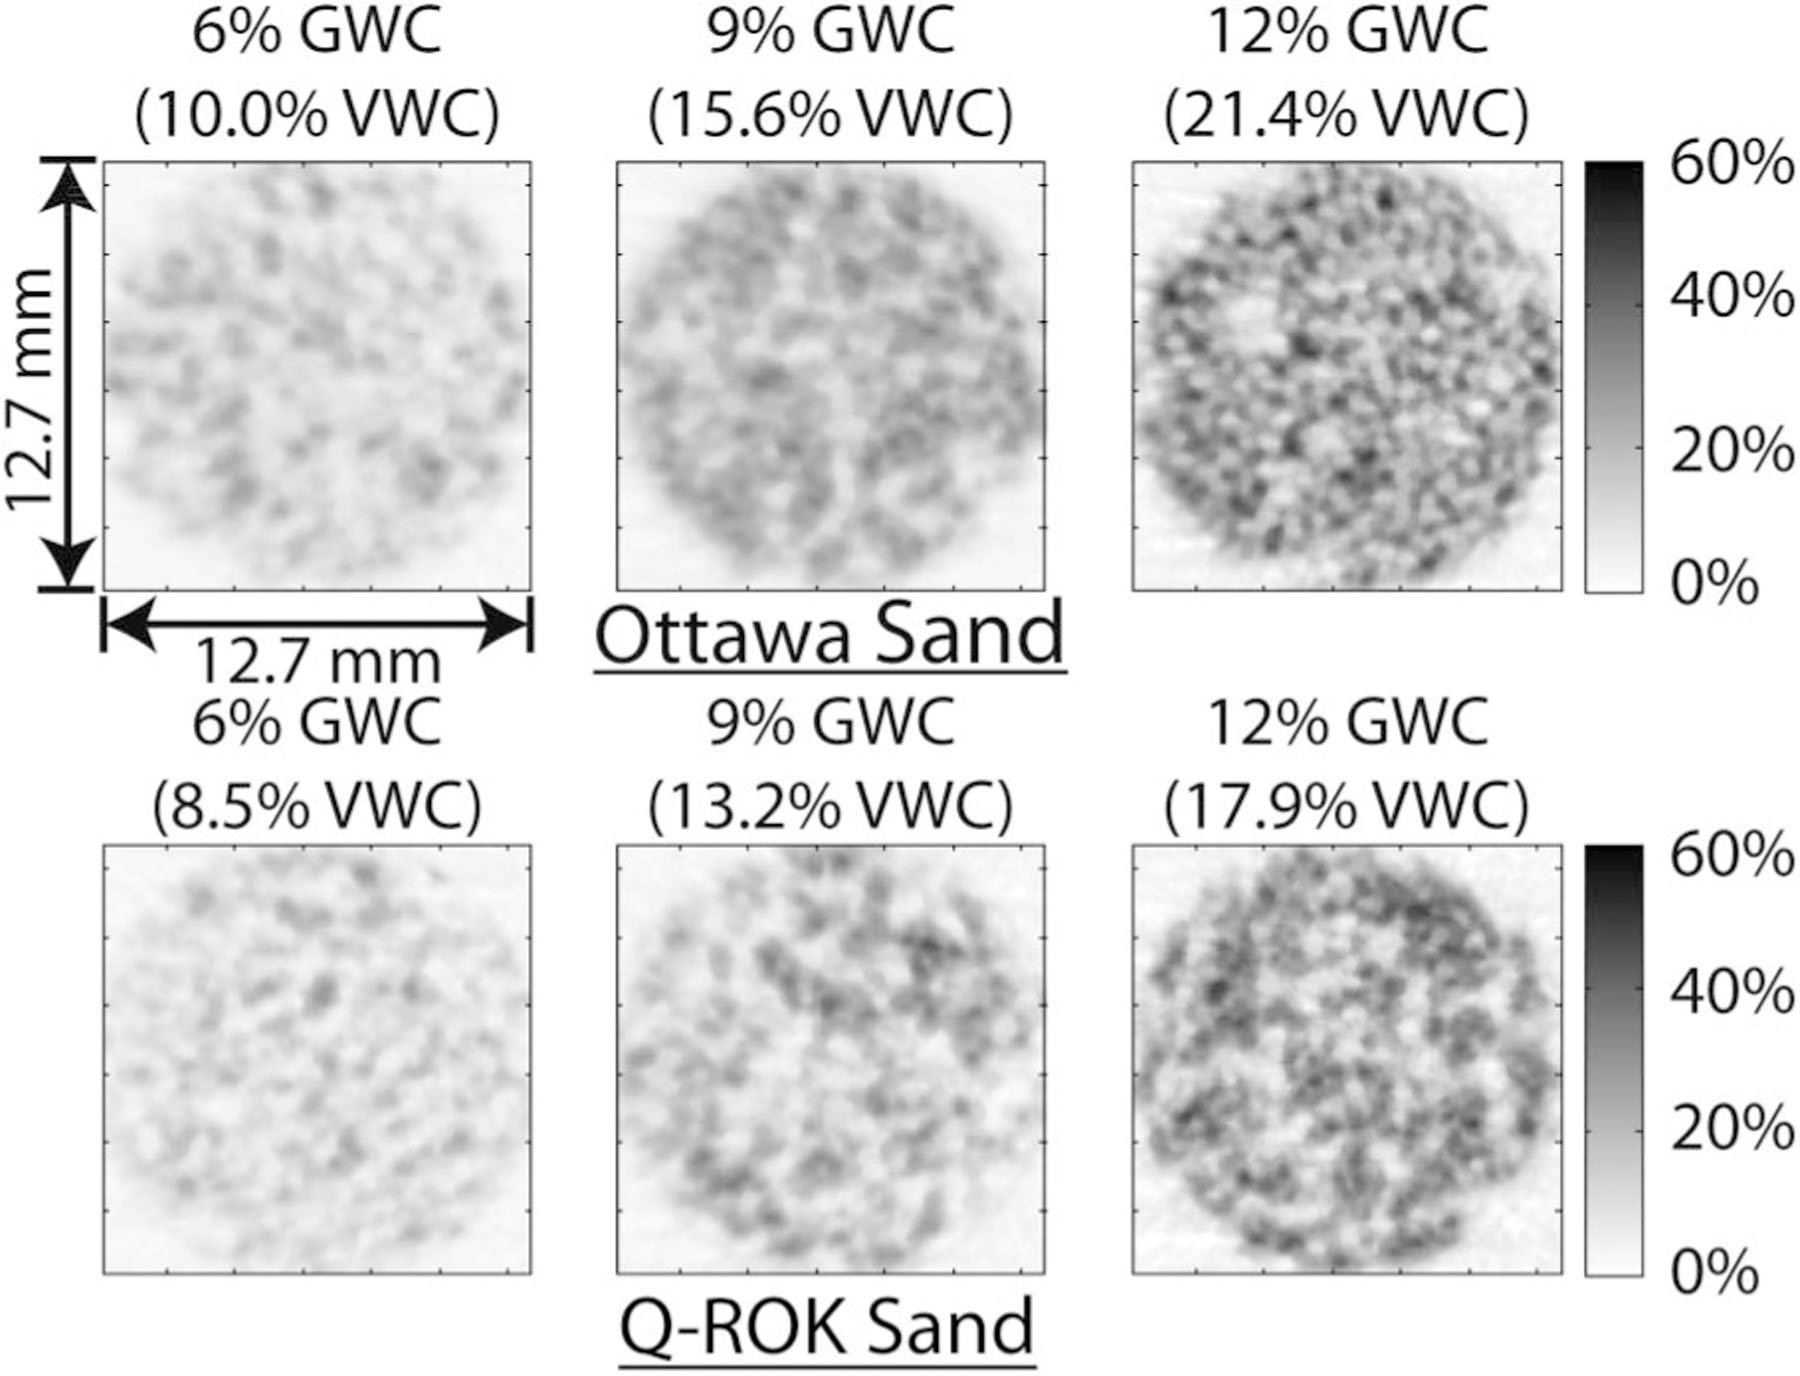
Contour plots of water saturation (WS) distribution on reconstructed tomography slices: (top) Ottawa sand; and (bottom) Q-ROK sand
Fig. 11.
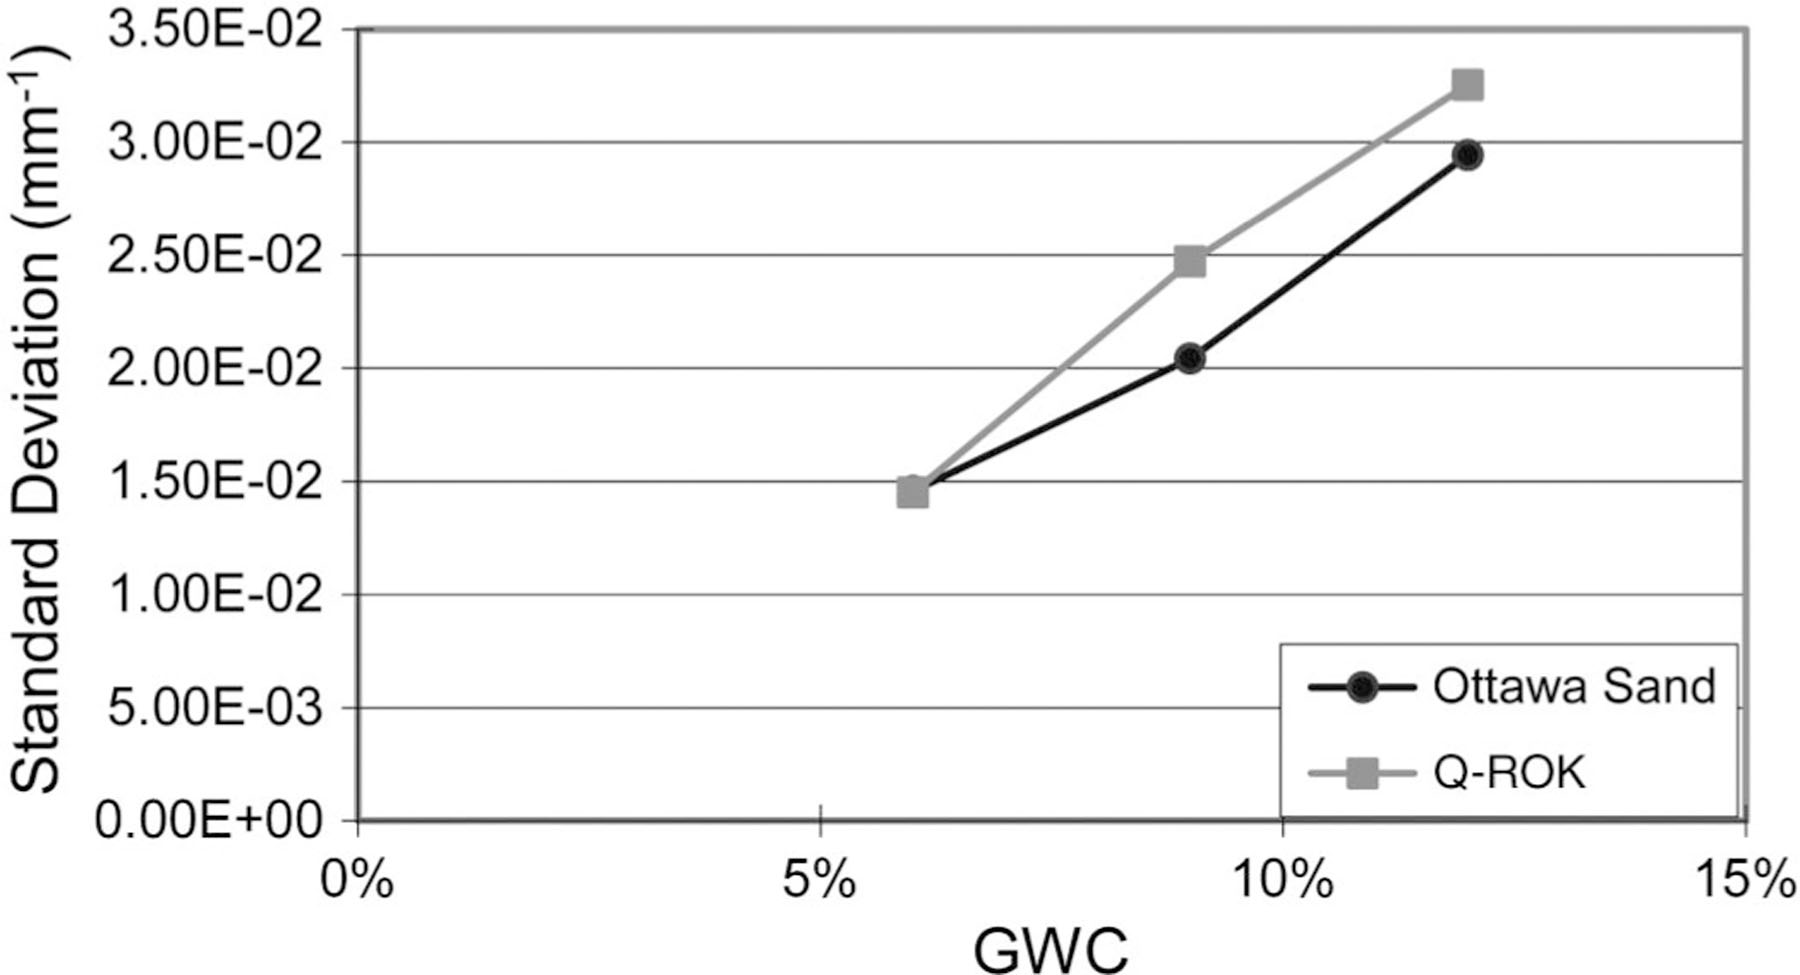
Comparison of standard deviation of histogram between Ottawa sand and Q-ROK sand
Fig. 12.

Comparison of three compaction layers of top (A-A), middle (B-B) and bottom (C-C) for 12% GWC Ottawa sand
The obtainable measurement precision of the system with respect to the prepared GWC of each specimen was determined. The 10 raw images using 1-s exposure time were used to create an average projection image with 10-s exposure time for Ottawa sand. Then, the standard deviation of each pixel was calculated from 10 sets of tomography data. Three tomography slices corresponding to GWC of 6%, 9%, and 12% were selected for each of 10 tomography sets. The maximum and average standard deviation values in mm−1 were divided by Σw = 0.3708 mm−1 and multiplied by 100% for each GWC to show the error bounds of the WS values. The result is shown in Fig. 13.
Fig. 13.
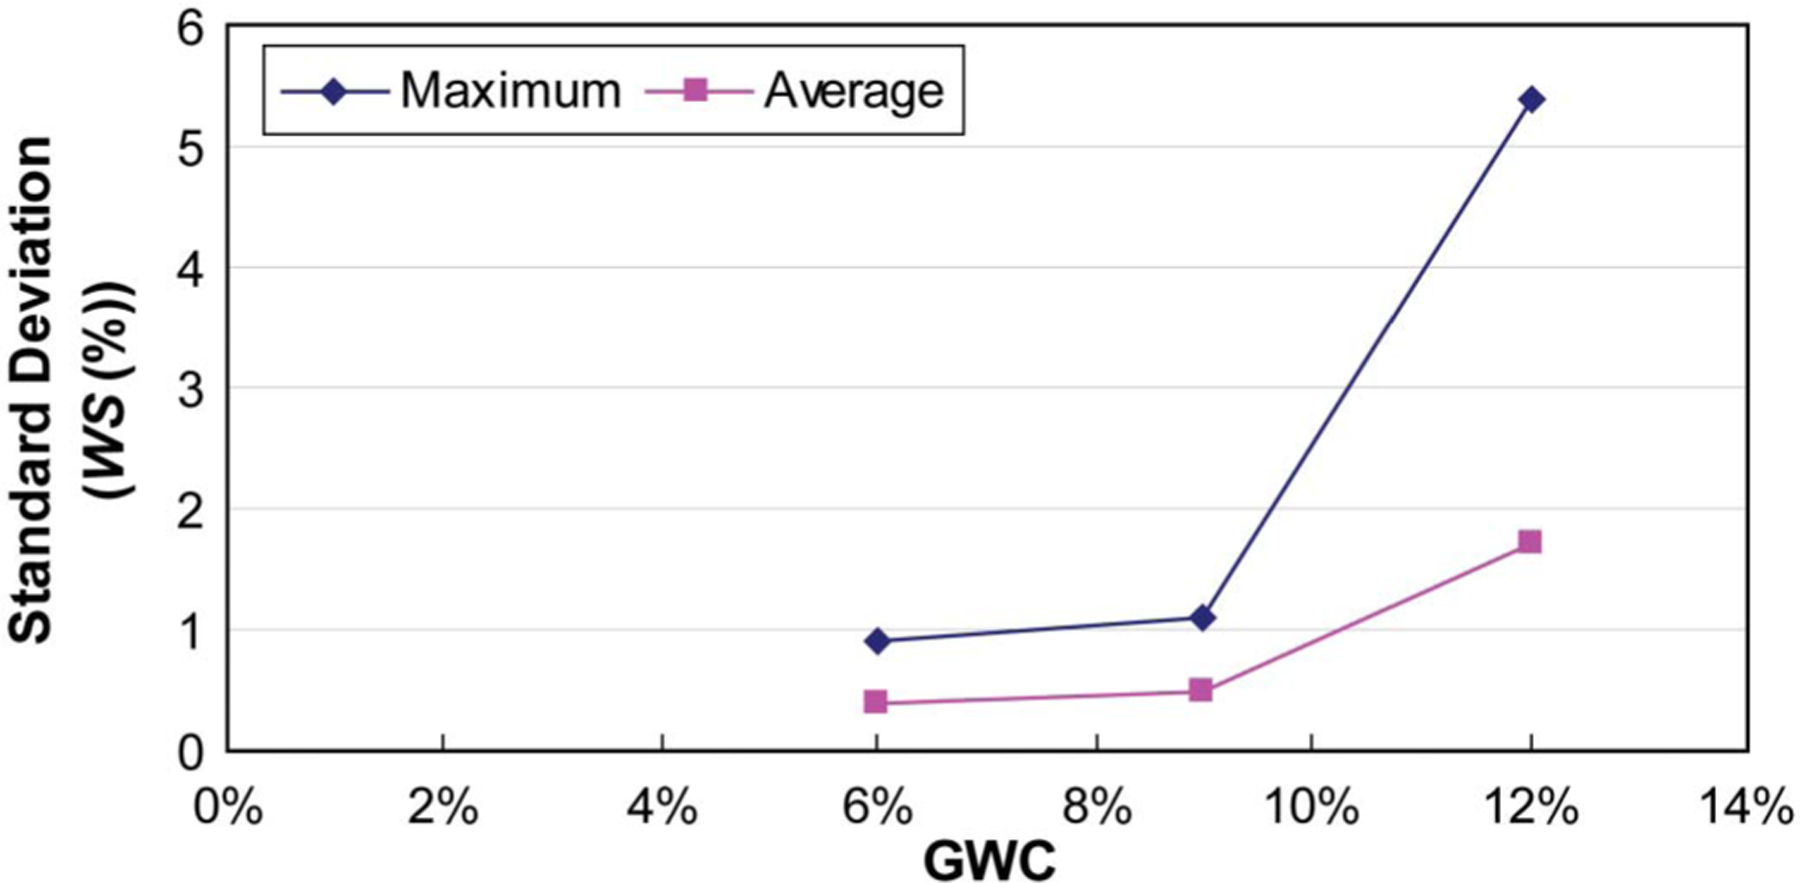
Maximum and average uncertainty of attenuation value comparison of Ottawa sand at GWC of 6%, 9%, and 12%
Conclusions
This paper explored the use of neutron imaging for studying water distribution in partially saturated granular materials. Silica sand specimens with two different morphologies (round and angular) were imaged using the neutron imaging facility at NIST. Neutron imaging is an alternative method to X-ray imaging for visualizing the three phases of wet granular materials without adding a contrast agent due to high natural contrast of neutrons for water, sand, and air phases with a large penetration depth suitable for investigating laboratory size samples nondestructively. The 250 μm spatial resolution (127 μm/pixel) images taken in this study was used to visualize features of water distribution around the sand particles (approximately 0.7 mm to 0.8 mm) adequately for eight different specimens. Some example contour plots were presented to visualize the water distribution variation quantitatively from 2D radiographs and 3D tomograms. For example, the specimens with 12% GWC (21.4% VWC Ottawa sand and 17.4% VWC Q-ROK sand) showed local WC variation of 5% to 28% for Ottawa sand and 5% to 25% for Q-ROK sand. For 12% GWC sand, the highest saturation value (WS) was approximately 50%. Some difference in water distribution from specimens of two different grain morphologies was also observed. The rounded Ottawa sand qualitatively showed a more uniform distribution than the angular Q-ROK sand. The specimens were compacted with three layers, and the bottom compaction layer showed a higher saturation of water than the top compaction layer possibly attributed to the effect of the compaction process coupled with gravity effect. The technique of neutron imaging has a great potential for studying the mechanics of wet granular materials under loading and soil with transient flow in the future, and the approach presented in this study can be extended.
Acknowledgments
This work was supported by the U.S. Dept. of Commerce, the NIST Ionizing Radiation Division, the Director’s office of NIST, the NIST Center for Neutron Research, and the Dept. of Energy interagency agreement No. DE-AI01–01EE50660.
Notation
The following symbols are used in this paper:
- D
diameter of aperture
- dp
detector pixel size
- e
void ratio
- GWC
gravimetric water content
- I
image taken with sample
- Iff
flat field count for exposure time tI
- IS
scattered beam intensity on detector pixel
- ISand
image of dry sand
- IT
transmitted beam intensity on detector pixel
- IWetSand
image of wet sand
- I0
reference image taken without sample (flat field image)
- L
distance from aperture to sample
- L/D
collimation ratio
- mT
total mass of wet sand
- N
number density
- O
sample to detector distance
- T
neutron transmission
- t
material thickness along beam path
- tI
integration time
- tc
total interior thickness of container
- ts
total thickness of sand
- tw
total thickness of water
- VWC
volumetric water content
- WC
volumetric water content in 2D radiograph
- WS
volumetric water saturation in 3D tomogram
- w
square cross-sectional side dimension of infinite line charge
- (x, y)
location of a pixel in 2D radiograph
- (x, y, z)
location of a voxel in 3D volumetric space
- λg
geometric unsharpness
- μ
attenuation coefficient
- ΣT
total macroscopic cross section
- Σrecon
macroscopic cross section of reconstructed slice
- Σs
macroscopic cross section of dry sand
- Σw
macroscopic cross section of water
- σ
standard relative uncertainty because of counting statistics
- σT
total microscopic cross section.
Appendix. Effect of Scattered Neutrons on Transmission Image
The effect of sample scattering on image formation of the given sample is estimated by assuming that there is an infinite line charge of neutron scattering from water with a square cross-section (w), at a distance from the detector (O) as shown in Fig. 14. The scattered neutron intensity (IS) (with unit counts per unit time) and transmitted neutron intensity (IT ) on a detector pixel with area being detector pixel size squared (dp2) as shown in Eqs. (8) and (9)
| (8) |
| (9) |
Fig. 14.
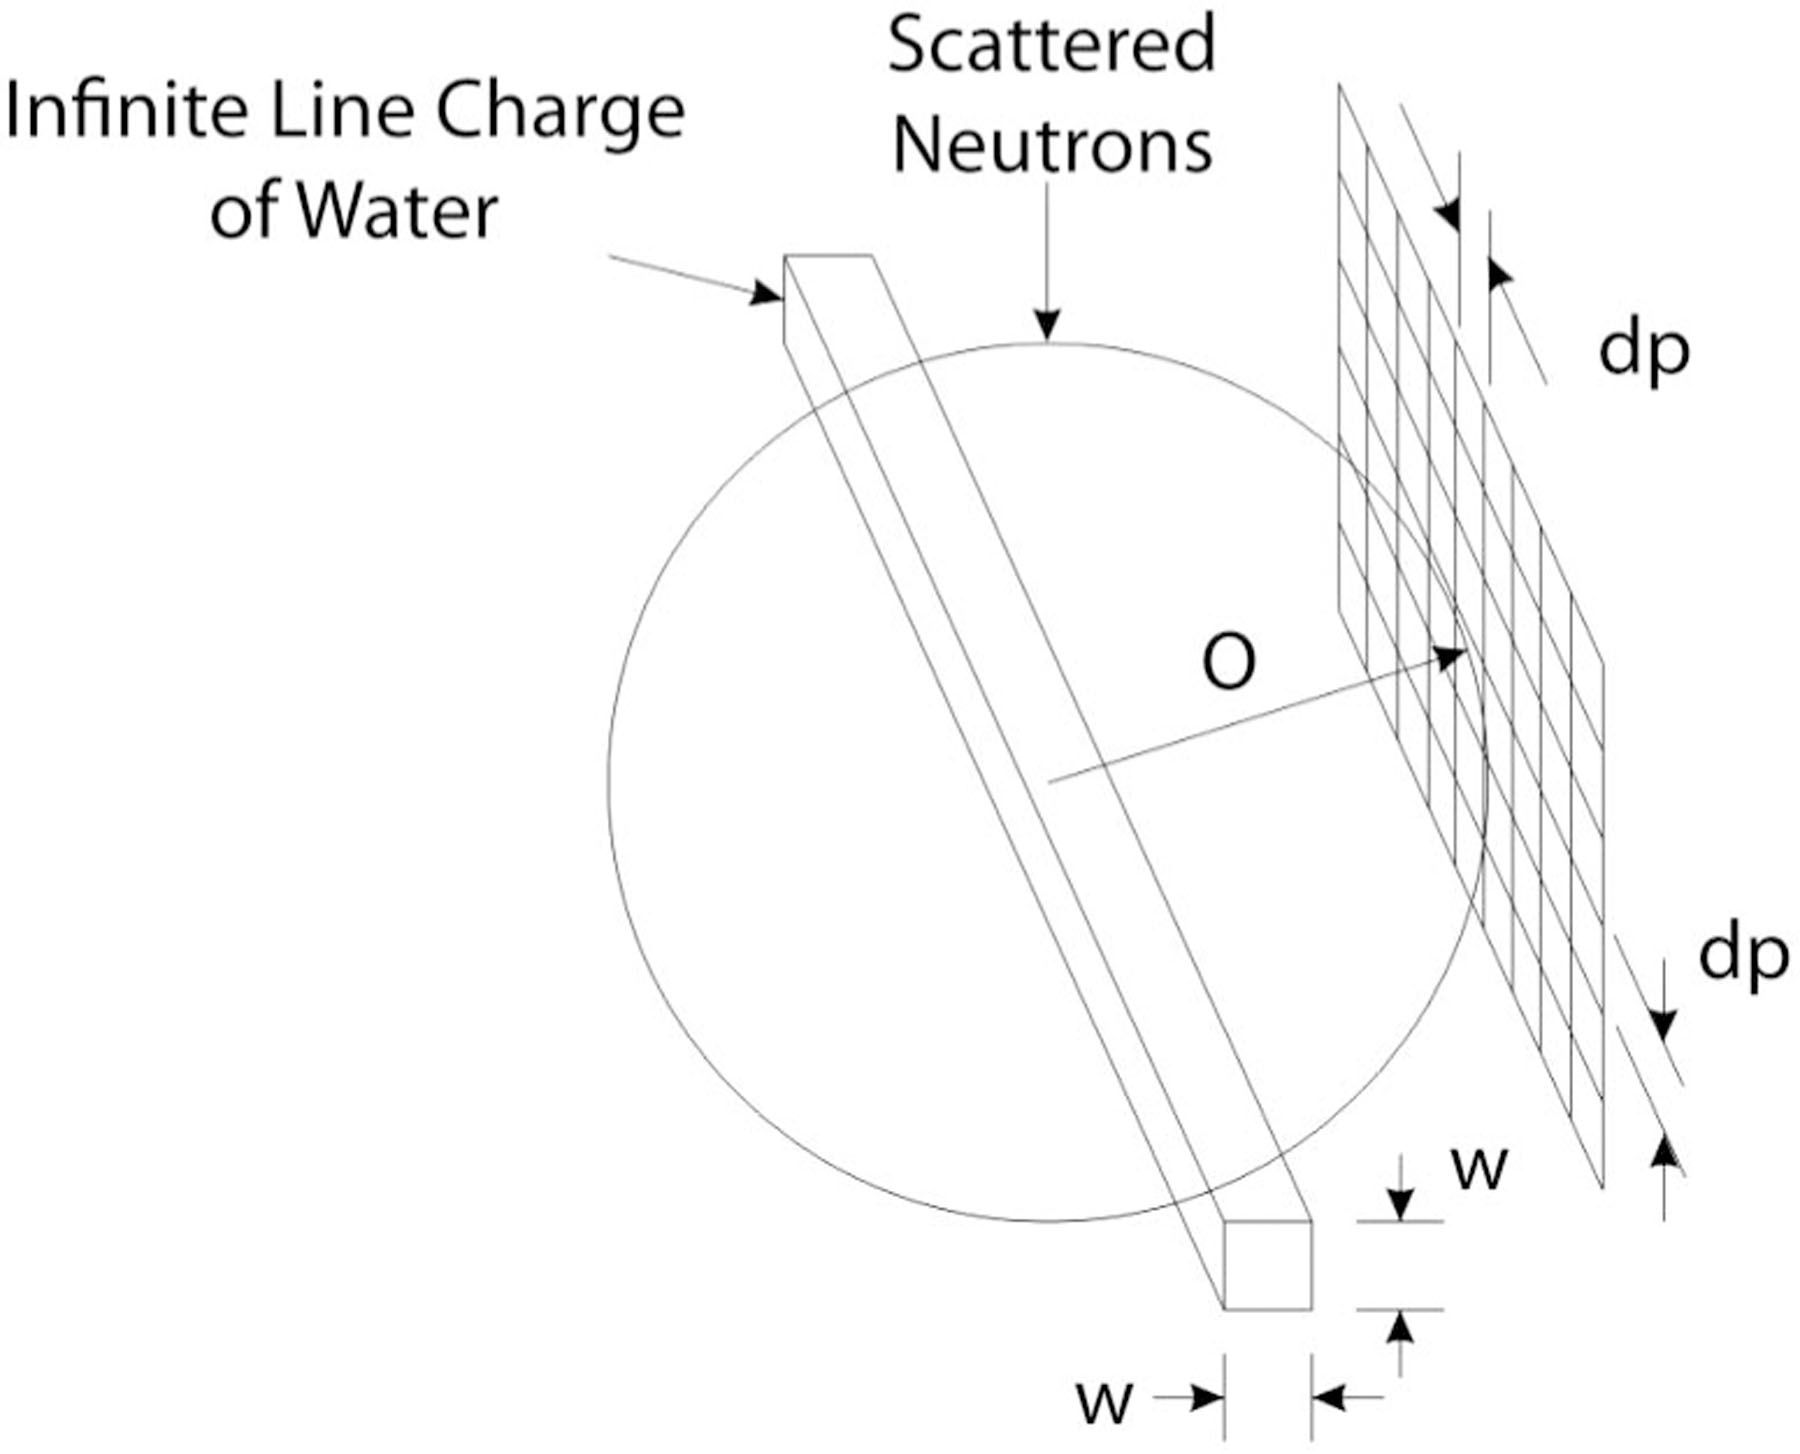
Effect of scattered neutrons on image formation from an infinite line charge
For the images in this study, w = 1 mm, Σw 0.3708 mm−1, and O = 20 mm. The ratio of scattered neutrons to the transmitted neutrons can be estimated as shown in Eq. (10)
| (10) |
To determine if a correction is necessary to account for this scattered beam, IS/IT can be comparedto the relative uncertainty because of counting statistics of the flat field (Iff ) for image exposure time (tI ), σ =(Iff tI )−1/2. In particular, a correction is required if IS/IT ~ σ. For a fluence rate of 4.3 × 106 cm−2 s−1, a detection efficiency of 20%, and a pixel pitch of 127 μm, Iff ≈ 140. Hence, σ ~ 0.0036 for an exposure time of 565 s. The integration time for each projection image during the experiment was only 10 s, and the infinite line charge assumption is the worst-case scenario. Therefore, the authors concluded that the scattered beam effect introduces negligible uncertainty in this study.
References
- Al-Raoush R, and Alshibli KA (2006). “Distribution of local void ratio in porous media systems from 3D X-ray microtomography images.” Physica A (Amsterdam), 361(2), 441–456. [Google Scholar]
- Al-Raoush RI, and Willson CS (2005). “A pore-scale investigation of a multiphase porous media system.” J. Contam. Hydrol, 77(1–2), 67–89. [DOI] [PubMed] [Google Scholar]
- Alshibli KA et al. (2000). “Assessment of localized deformations in sand using X-ray computed tomography.” Geotech. Test. J, 23(3), 274–299. [Google Scholar]
- Arif M, Hussey DS, and Jacobson DL (2008). “Neutron imaging for the hydrogen economy.” Neutron imaging and applications, Anderson IS, McGreevey RL, and Bilheux HZ, eds., Springer, New York. [Google Scholar]
- Barranco FT, Dawson HE, Christener JM, and Honeyman BD (1997). “Influence of aqueous pH and ionic strength on the wettability of quartz in the presence of dense nonaqueous-phase liquids.” Environ. Sci. Technol, 31(3), 676–681. [Google Scholar]
- de Beer FC, and Middleton MF (2006). “Neutron radiography imaging, porosity, and permeability in porous rocks.” S. Afr. J. Geol, 109(4), 541–550. [Google Scholar]
- Desrues J, Chambon R, Mokni M, and Mazerolle F. (1996). “Void ratio evolution inside shear bands in triaxial sand specimens studied by computed tomography.” Géotechnique, 46(3), 529–546. [Google Scholar]
- Han J, Jin Y, and Willson CS (2006). “Virus retention and transport in chemically heterogeneous porous media under saturated and unsaturated flow conditions.” Environ. Sci. Technol, 40(5), 1547–1555. [DOI] [PubMed] [Google Scholar]
- Hassanein R, Lehmann E, and Vontobel P. (2005). “Methods of scattering corrections for quantitative neutron radiography.” Nucl. Instrum. Methods Phys. Res., Sect. A, 542(1–3), 353–360. [Google Scholar]
- Hassanein R, Meyer HO, Carminati A, Estermann M, Lehmann E, and Vontobel P. (2006). “Investigation of water imbibition in porous stone by thermal neutron radiography.” J. Phys. D, 39(19), 4284–4291. [Google Scholar]
- Hussey DS, Jacobson DL, Arif M, Coakley KJ, and Vecchia DF (2010). “In situ fuel cell water metrology at the NIST neutron imaging facility.” J. Fuel Cell Sci. Technol, 7(2), 021024–021030. [Google Scholar]
- Jaeger HM, Nagel SR, and Behringer RP (1996). “Granular solids, liquids, and gases.” Rev. Mod. Phys, 68(4), 1259–1273. [Google Scholar]
- Jasti JK, and Fogler HS (1992). “Application of neutron radiography to image flow phenomena in porous media.” AIChE J, 38(4), 481–488. [Google Scholar]
- Kak AC, and Slaney M. (2001). Principles of computerized tomographic imaging, Society for Industrial and Applied Mathematics, Philadelphia. [Google Scholar]
- Kohonen MM, Geromichalos D, Scheel M, Schier C, and Herminghaus S. (2004). “On capillary bridges in wet granular materials.” Physica A (Amsterdam), 339(1–2), 7–15. [Google Scholar]
- Lanza RC (2008). “Homeland security and contraband detection.” Neutron imaging and applications, Anderson IS, McGreevey RL and Bilheux HZ, eds., Springer, New York. [Google Scholar]
- Lewis JT, and Krinitzsky EL (1976). “Neutron radiation in the study of soil and rock.” Practical applications of neutron radiography and gaging, Berger H, ed., American Society for Testing and Materials, Baltimore, MD, 241–251. [Google Scholar]
- Lopes RT, Bessa AP, Braz D, and de Jesus EFO (1999). “Neutron computerized tomography in compacted soil.” Appl. Radiat. Isot, 50(2), 451–458. [Google Scholar]
- Lu N, Zeidman BD, Lusk MT, Willson CS, and Wu DT (2010). “A Monte Carlo paradigm for capillarity in porous media.” Geophys. Res. Lett, 37(23), L23402–L23407. [Google Scholar]
- Milczarek JJ, Czachor A, Abd El-Ghany EA, and Wisniewski Z. (2005). “Dynamic neutron radiography observations of water migration in porous media.” Nucl. Instrum. Methods Phys. Res., Sect. A, 542(1–3), 232–236. [Google Scholar]
- Nakanishi TM (2008). “Neutron imaging applied to plant physiology.” Neutron imaging and applications, Anderson IS, McGreevey RL and Bilheux HZ, eds., Springer, New York. [Google Scholar]
- Oda M, Takemiura T, and Takahashi M. (2004). “Microstructure in shear band observed by microfocus X-ray computed tomography.” Géotechnique, 54(8), 539–542. [Google Scholar]
- Penumadu D. (2008). “Material science and engineering with neutron imaging.” Neutron imaging and applications, Anderson IS, McGreevey RL and Bilheux HZ, eds., Springer, New York. [Google Scholar]
- Penumadu D, Dutta A, Luo X, and Thomas K. (2009). “Nano and neutron science applications for geomechanics.” KSCE J. Civ. Eng, 13(4), 233–242. [Google Scholar]
- Pleinert H, and Degueldre C. (1995). “Neutron radiographic measurement of porosity of crystalline rock samples: A feasibility study.” J. Contam. Hydrol, 19(1), 29–46. [Google Scholar]
- Scheel M. et al. (2008). “Morphological clues to wet granular pile stability.” Nat. Mater, 7(3), 189–193. [DOI] [PubMed] [Google Scholar]
- Schiffer P. (2005). “Granular physics: A bridge to sandpile stability.” Nat. Phys, 1(1), 21–22. [Google Scholar]
- Schnaar G, and Brusseau ML (2005). “Pore-scale characterization of organic immiscible-liquid morphology in natural porous media using synchrotron X-ray microtomography.” Environ. Sci. Technol, 39(21), 8403–8410. [DOI] [PubMed] [Google Scholar]
- Trabold TA, Owejan JP, Gagliardo JJ, Jacobson DL, Hussey DS, and Arif M. (2009). “Use of neutron imaging for proton exchange membrane fuel cell (PEMFC).” Handbook of fuel cells, Vielstich W, Gasteiger HA and Yokokawa H, eds., Wiley, West Sussex, England. [Google Scholar]
- Tullis BP, Lindsay JT, and Wright SJ (1994). “The imaging of wetting front instabilities in porous media using neutron radioscopy.” Nondestr. Test. Eval, 11(2–3), 97–106. [Google Scholar]
- Vlassenbroeck J, Dierick M, Masschaele B, Cnudde V, Van Hoorebeke L, and Jacobs P. (2007). “Software tools for quantification of X-ray microtomography at the UGCT.” Nucl. Instrum. Methods Phys. Res., Sect. A, 580(1), 442–445. [Google Scholar]
- Watkin KL, Bilheux HZ, and Ankner JF (2008). “Probing the potential of neutron imaging for biomedical and biological applications.” Neutron imaging and applications, Anderson IS, McGreevey RL and Bilheux HZ, eds., Springer, New York. [Google Scholar]
- Wellington SL, and Vinegar HJ (1987). “X-ray computerized tomography.” J. Pet. Technol, 39(8), 885–898. [Google Scholar]


