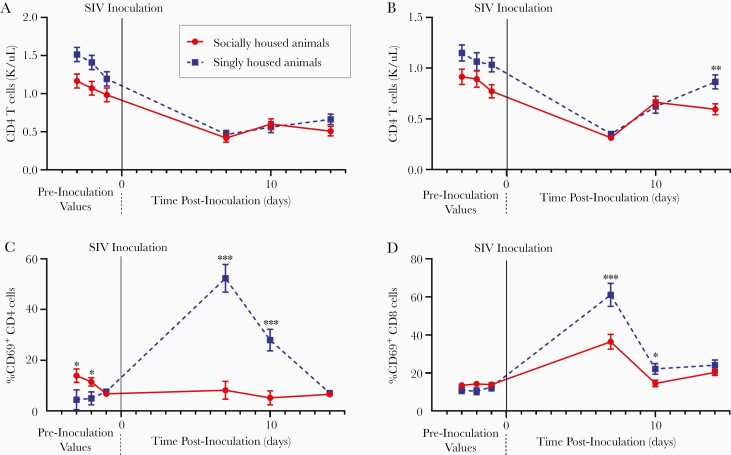
Figure 2.
Psychosocial stress increases the immune impact of acute simian immunodeficiency virus (SIV) infection. CD4 T cells (A) and CD8 T cells (B) in the peripheral blood of macaques pre- and postinoculation with SIV. Percentage of CD4 T cells expressing CD69 (C), and percentage of CD8 T cells expressing CD69 (D). Linear mixed-effects regression model. Statistics depicted in figure represent significance of difference between singly and socially housed animals at each time point. *, P ≤ .05; **, P ≤ .01; and ***, P ≤ .001. Circles connected by a solid line (red) indicate socially housed animals, whereas squares connected by a dashed line (blue) represent singly housed animals. Solid vertical line at day 0 indicates time point of SIV inoculation. Error bars represent the standard error of the least square mean estimates generated by the linear mixed-effects regression model. Antiretroviral therapy initiated on day 12 postinoculation. CD4 T cells and CD8 T cells (1) social housed group N = 35 at preinoculation time point 1, N = 40 at preinoculation time point 3 and N = 41 at preinoculation time point 2 and all days postinoculation; (2) single housed group N = 34 at all preinoculation time points, N = 35 at day 7, N = 33 at day 10, and N = 17 at day 14 postinoculation. %CD69 (CD8 T cells) (1) social housed group N = 35 at preinoculation time point 1, N = 40 at preinoculation time point 3 and N = 41 at preinoculation time point 2 and all days postinoculation; (2) single housed group N = 17 at all preinoculation time points and at day 7 postinoculation, N = 14 at day 10 postinoculation and N = 11 at day 14 postinoculation. %CD69 (CD4 T cells) (1) social housed group N = 35 at preinoculation time point 1, N = 40 at preinoculation time point 3 and N = 41 at preinoculation time point 2 and all days postinoculation; (2) single housed group N = 17 at all preinoculation time points, days 7 and 10 postinoculation and N = 11 at day 14 postinoculation.

