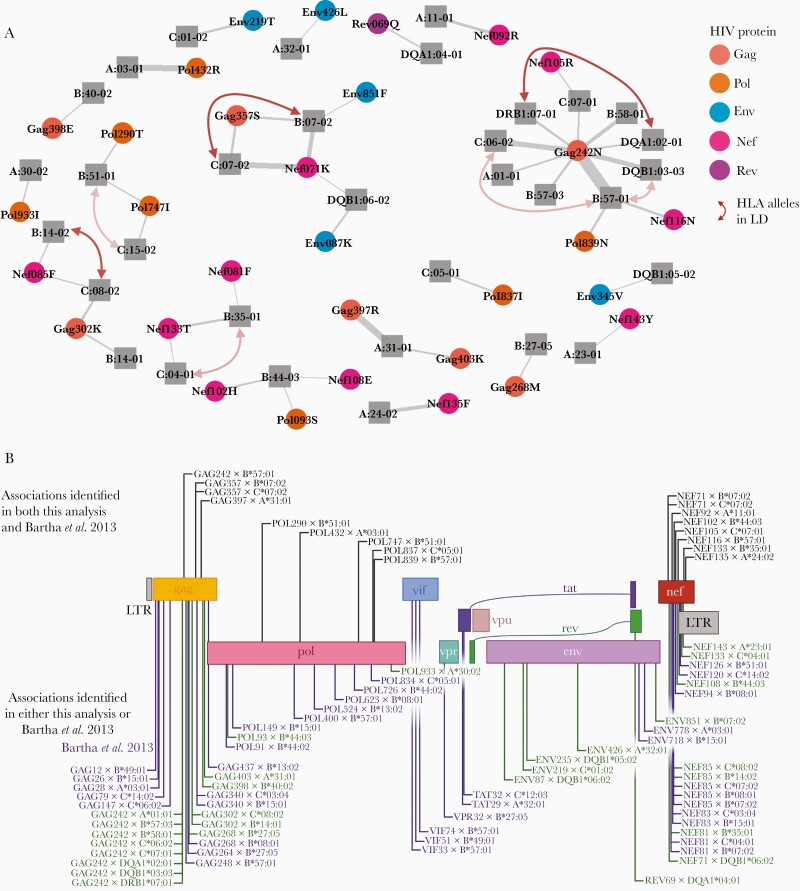
Figure 3.
A, Network of the associated HLA alleles and HIV AA variants where line thickness represents the association’s strength and red arrows mark HLA alleles in LD. The opacity of the arrows corresponds to squared correlation coefficient (R2). B, Comparison between the HLA type and HIV AA associations identified in this analysis and the Bartha et al study [19]. Abbreviations: AA, amino acid; HIV, human immunodeficiency virus; LD, linkage disequilibrium; LTR, long terminal repeat.

