
FIGURE 3.
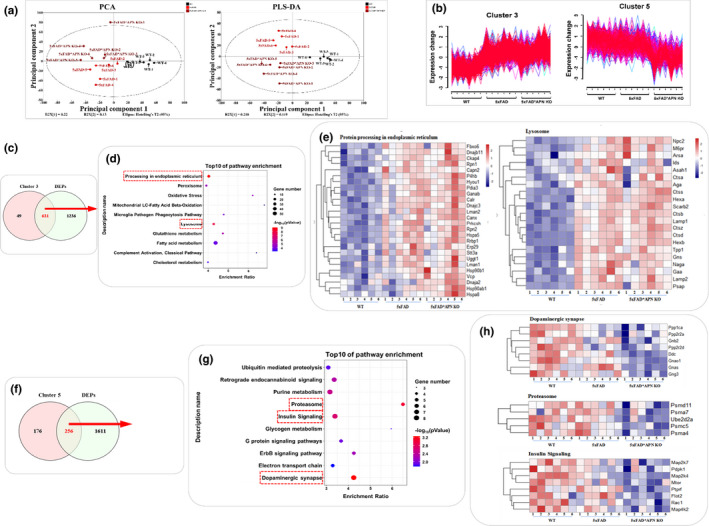
Proteome profiling overview of brain hippocampus in WT, 5xFAD, and 5xFAD*APN KO mice. Principal component analysis (PCA) and partial least squares‐discriminate analysis (PLS‐DA) of total proteins identified. (b) The expression patterns of cluster 3 and cluster 5. (c, f) The Venn diagram analysis between DEPs and cluster 3/5. (d, g) KEGG pathway analysis of 631 DEPs in cluster 3 and 256 DEPs in cluster 5. (e, h) The DEPs cluster 3 and 5 involved in the essential pathways were visualized by hierarchical heatmap clustering