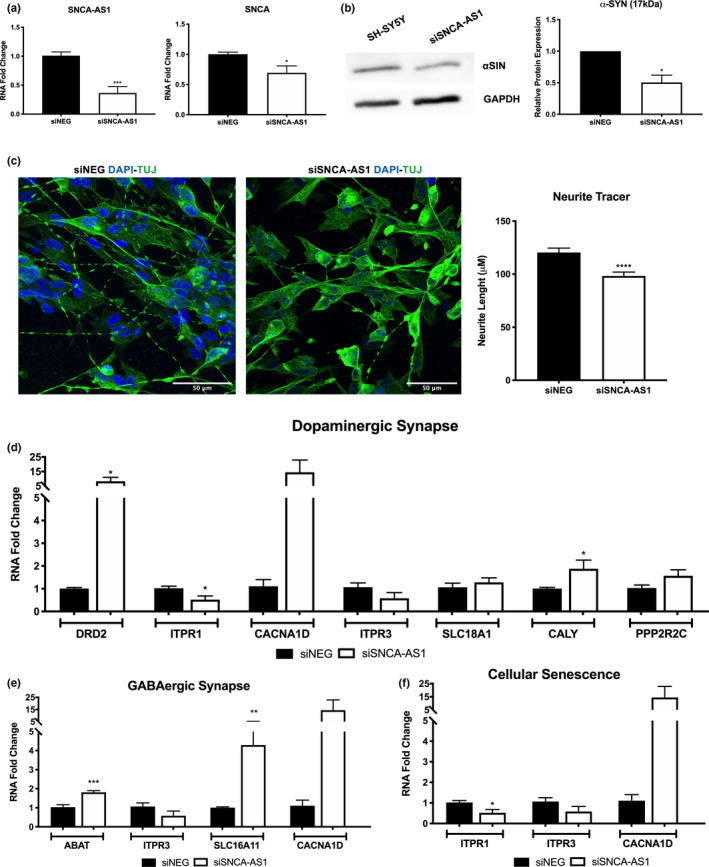
FIGURE 6.

SNCA‐AS1 downregulation reduces α‐syn expression and synaptic length in differentiated SH‐SY5Y cells. (a) Real‐time PCR expression of SNCA‐AS1 and SNCA when SNCA‐AS1 expression was knocked‐down with RNA interference technique (siSNCA‐AS1) in SH‐SY5Y cells differentiated for 7 days with retinoic acid. Results are an average of 4 independent experiments, each one performed in duplicates (N = 8, *p < 0.05, ***p < 0.001 vs siNEG). (b) Western blot analysis of α‐syn expression when SNCA‐AS1 expression was knocked‐down (siSNCA‐AS1). Results are an average of 3 independent experiments (N = 3, *p < 0.05 vs siNEG). The graph reports the quantification of the WB bands. (c) Representative immunofluorescence images of TUJ expression in SH‐SY5Y differentiated for 7 days with retinoic acid in presence of siNEG and siSNCA‐AS1. Nuclei were labeled in blue (DAPI). Scale bar 50 μm. Neurite Tracer analysis is presented as mean of the quantification of 10 cells performed in 3 different fields for each condition, in 3 independent experiments ±SEM (n = 90, ***p < 0.001 vs. siNEG). Real‐time PCR analysis of genes correlated with Dopaminergic Synapse (d), GABAergic Synapse (e), and Cellular Senescence (f) in siSNCA‐AS1 vs siNEG. Results are an average of 4 independent experiments performed in duplicates (N = 8, *p < 0.05, **p < 0.01, ***p < 0.001 vs. siNEG)
