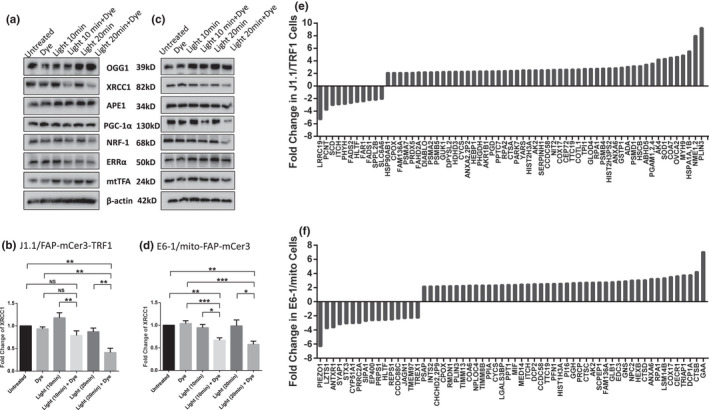
FIGURE 5.

Western blot and mass spectrometry analysis. (a, c) Representative western blots of the DNA repair proteins (OGG1, XRCC1, and APE1), the PGC‐1α network proteins (PGC‐1α, NRF‐1, ERRα), and mtTFA in J1.1/FAP‐mCer3‐TRF1 cells (a) and E6‐1/mito‐FAP‐mCer3 cells (c) with or without MG2I and light exposure for 10~20 min/day for 3 days. (b, d) Summary data of XRCC1 protein levels in J1.1/FAP‐mCer3‐TRF1 cells from 5 independent experiments (b) and E6‐1/mito‐FAP‐mCer3 cells from 8 independent experiments (d) with or without MG2I and light exposure for 10~20 min/day for 3 days (*p < 0.05; **p < 0.01; ***p < 0.001; NS = no significance, one‐way ANOVA). (e) Proteomic analysis of protein changes due to oxidative stress at telomeres in J1.1/FAP‐mCer3‐TRF1 cells treated with MG2I and light exposure for 20 min/day for 3 days compared to the controls. (f). Changes in protein levels due to oxidative stress at mitochondria in E6‐1/mito‐FAP‐mCer3 cells treated with MG2I and light exposure for 20 min/day for 3 days compared to the controls, analyzed by LC‐MS
