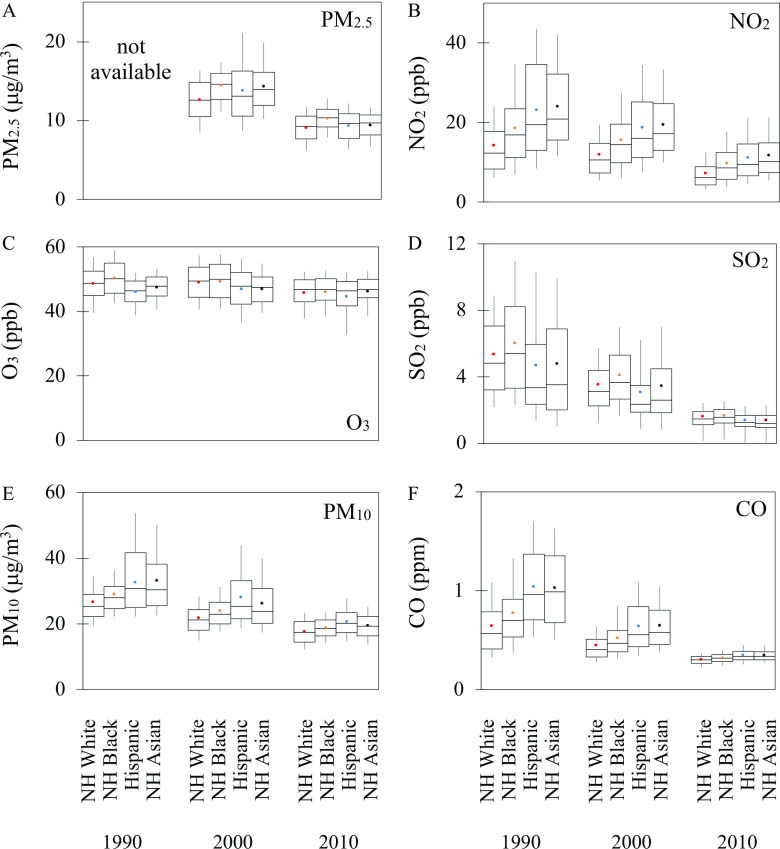
Figure 1.
Distribution of exposure to pollutants in years 1990, 2000, and 2010, stratified by racial/ethnic group, for (A) , (B) , (C) , (D) , (E) , and (F) CO. For all panels, the highest/lowest bound represents the 90th/10th percentile value, the box shows the 25th and 75th percentiles, and the horizontal line in the box represents the median. Color circles indicate the national population-weighted mean. has no estimates in 1990 because of a lack of monitoring data prior to 1999. Note: CO, carbon monoxide; Hispanic, Hispanic people of any race(s); NH, non-Hispanic; , nitrogen dioxide; , ozone; , fine particulate matter with aerodynamic diameter less than or equal to ; ; , sulfur dioxide.

