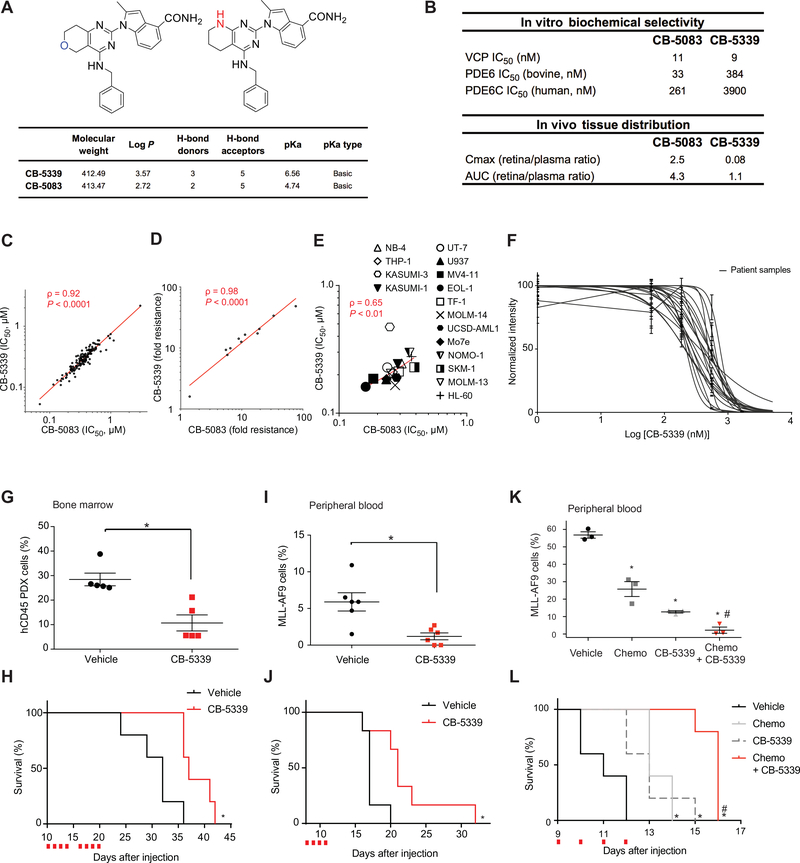
Figure 6. Targeting VCP in AML through a second-generation VCP inhibitor: CB-5339.
(A) Chemical structure and properties of CB-5339 compared to CB-5083. (B) CB-5339 in vitro biochemical selectivity towards PDE6 and retina/plasma tissue distribution compared to CB-5083. (C) Linear regression analysis of IC50 distribution of a panel of 138 cell lines treated with CB-5339 or CB-5083 for three days in duplicates. Non-parametric Spearman correlation coefficient (ρ) and associated P-value. (D) Linear regression analysis of IC50 distribution of a panel of 11 HCT116 cell lines carrying resistance mutations to CB-5083, treated with CB-5339 or CB-5083 for three days in duplicates. Results are presented as fold resistance compared to the parental HCT116 cell line. Non-parametric Spearman correlation coefficient (ρ) and associated P-value. (E) Linear regression analysis of IC50 distribution of a panel of 16 AML cell lines treated with CB-5339 or CB-5083 (four replicates for each condition). Non-parametric Spearman correlation coefficient (ρ) and associated P-value. (F) Growth inhibition of 16 primary patient AML samples treated with increasing concentrations of CB-5339 for six days. Error bars represent mean of two replicates ± SEM. (G) Proportion of hCD45+ leukemic cells in mice bone marrow (n=5 mice per condition) 21 days post-injection of patient-derived primary AML cells. CB-5339 treatment was started 10 days post-injection, after engraftment validation. Mann-Whitney test in comparison with vehicle. Error bars represent mean ± SEM. * p<0.05. (H) Kaplan-Meier curves showing overall survival of mice (n=5 mice per condition) transplanted with patient-derived primary AML cells and treated with CB-5339 at 90 mg/kg. Red squares indicate days of CB-5339 treatment. Log-rank (Mantel-Cox) test. * p < 0.05 by comparison with vehicle. (I) Proportion of MLL-AF9 cells in peripheral blood (n=6 mice per condition) 12 days post-injection of MLL-AF9 cells. CB-5339 treatment was started at day 8. Mann-Whitney test in comparison with vehicle. Error bars represent mean ± SEM. * p<0.05. (J) Kaplan-Meier curves showing overall survival of mice (n=6 per condition) transplanted with MLL-AF9 and treated with CB-5339 at 90 mg/kg. Red squares indicate days of CB-5339 treatment. Log-rank (Mantel-Cox) test. * p < 0.05 by comparison with vehicle. (K) Proportion of MLL-AF9 cells in peripheral blood (n=3 mice per condition) 11 days post-injection of MLL-AF9 cells. Treatment was started at day 9 (CB-5339 at 50 mg/kg for 4 days, Chemo : Doxorubicin at 0.5 mg/kg for 3 days and cytarabine at 75 mg/kg for 5 days). Welch’s t-test. Error bars represent mean ± SEM. * p < 0.05 by comparison with vehicle. # p < 0.05 by comparison with CB-5339 or Chemo groups. (L) Kaplan-Meier curves showing overall survival of mice (n=5 per condition) transplanted with MLL-AF9 and treated as indicated. Red squares indicate days of CB-5339 treatment. Log-rank (Mantel-Cox) test. * p < 0.05 by comparison with vehicle. # p < 0.05 by comparison with CB-5339 or Chemo groups.

