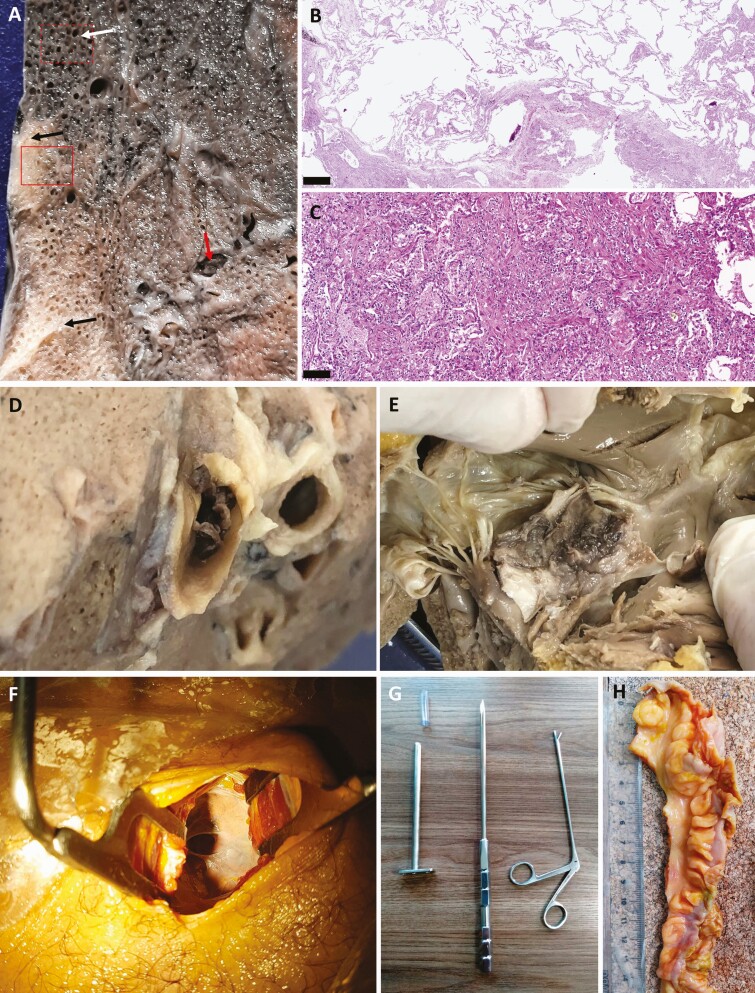
Figure 2.
A, Macroscopic view of pulmonary fragment sampled from a late coronavirus disease 2019 case obtained by a small thoracotomy guided by ultrasound image. Red arrows indicate thromboembolic event. B, Microscopic view showing areas of overinflation and disrupted alveolar septa (corresponding to white arrow and red dotted line rectangle marked in A). C, Foci of subpleural condensation with fibrotic bundle deposition and reactive epithelium (corresponding to black arrows and solid red line rectangle marked in A). D, Macroscopic view of a pulmonary thrombus. E, Tricuspid valve leaflet of the same patient showing a valvular thrombus. F, Skin and chest wall incision. G. Instruments used to insert optics and forceps for dissections. H, Segment of the intestines obtained with the dissection technique. Scale bar for microscopic images = 500 µm.

