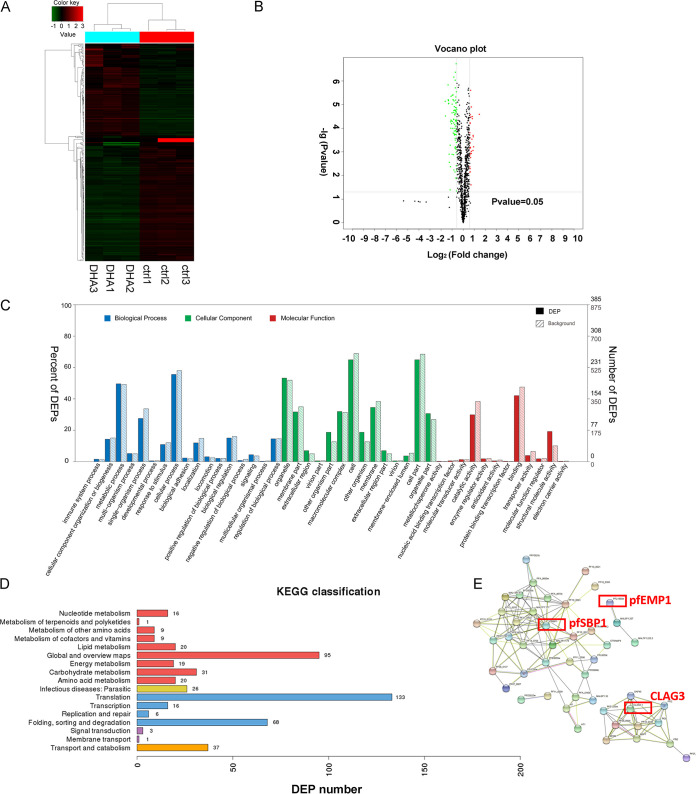
FIG 3.
Proteomics analysis of the parasite-infected red blood cell (iRBC) membrane after dihydroartemisinin (DHA) treatment. (A) Unsupervised hierarchical cluster analysis of differentially expressed proteins (DEPs). (B) Volcano plot displaying DEPs within two groups. The y axis shows the mean expression value of log10 (q value), and the x axis displays the log2 fold change (FC) value. Black dots represent proteins that did not reach statistical significance (q > 0.05); red and green dots represent proteins whose expression levels were significantly different (q < 0.05). (C) Gene Ontology (GO) function classification of DEPs. The abscissa is the content of the secondary function classification of the GO database, and the ordinate is the percentage of DEPs contained in the corresponding secondary functional classification (left) and number (right). (D) Kyoto Encyclopedia of Genes and Genomes (KEGG) classification of DEPs. Number of annotated proteins (x axis) versus KEGG categories (y axis). (E) STRING analysis of proteins decreased in the ring stage of Plasmodium falciparum 3D7 after DHA treatment. Proteins are shown as nodes, and the color of each link defines the type of evidence available for the interaction between two proteins (e.g., blue: cooccurrence; black: coexpression; purple: experimental; aqua: databases; green: text mining; light blue: homology).

