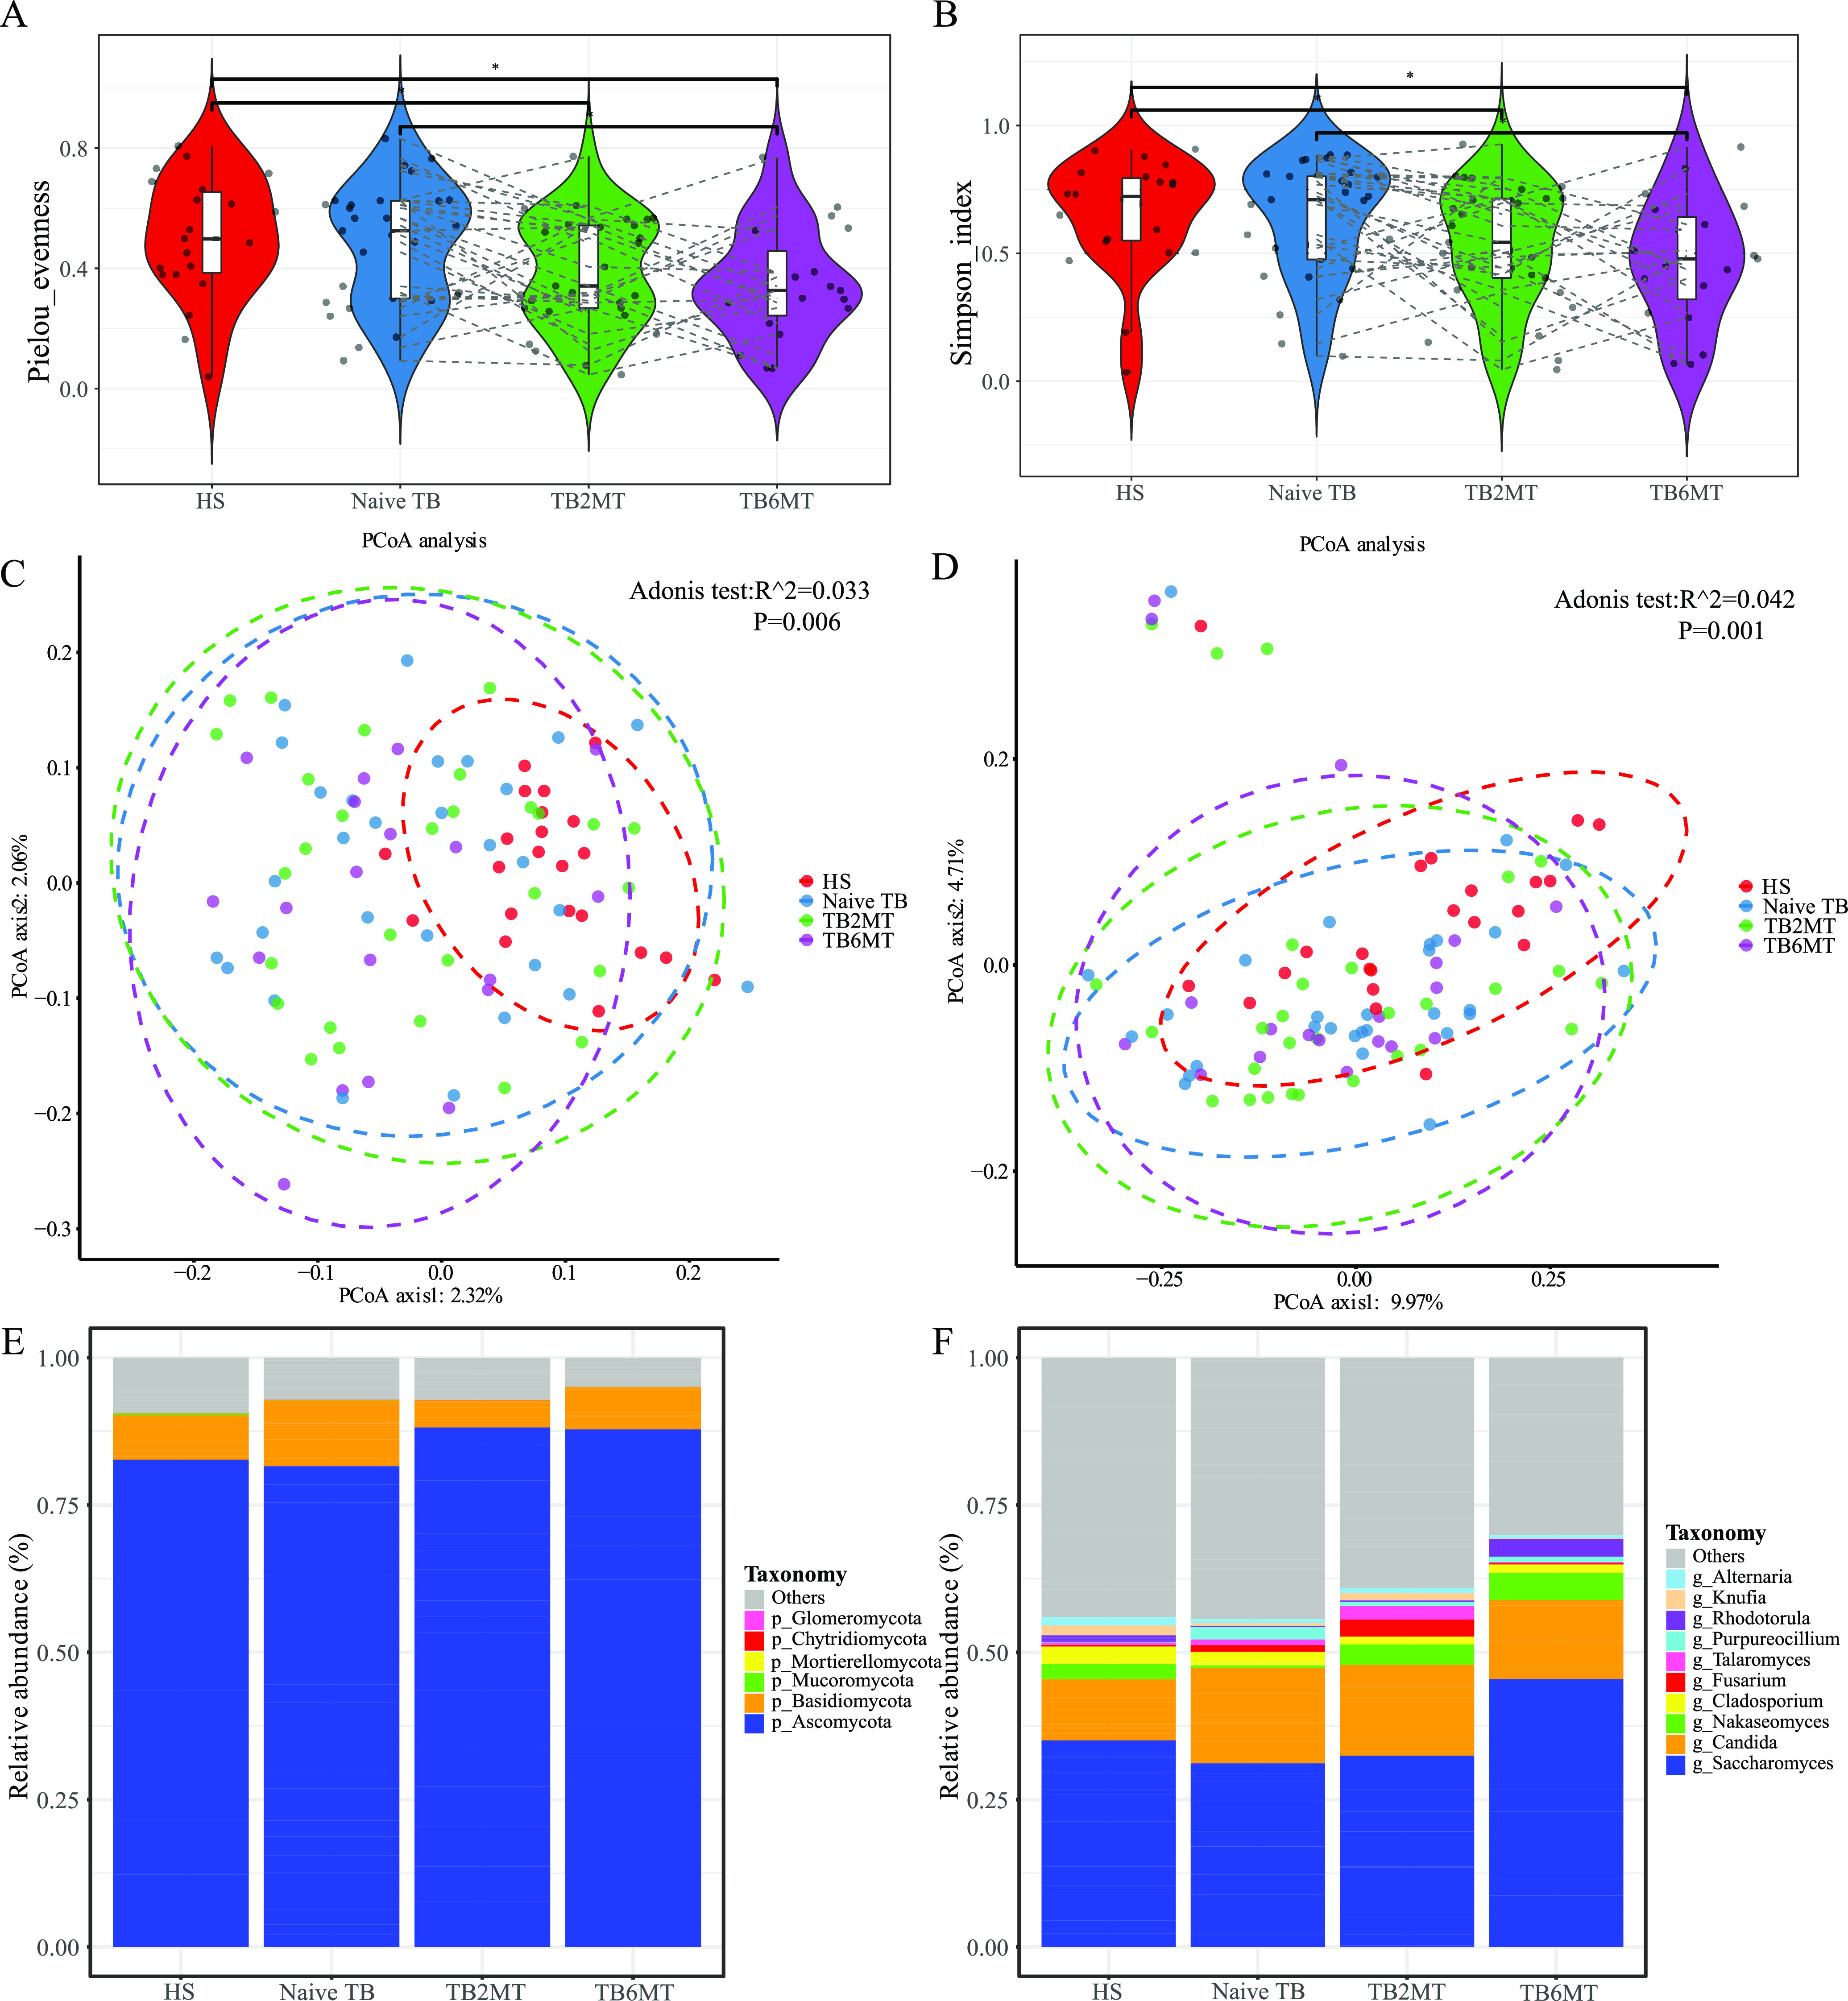
FIG 2.

Altered mycobiota biodiversity in TB patients. The α-diversity of the mycobiota at the genus level based on (A) Pielou evenness and (B) the Simpson index. PCoA analysis using the (C) Jaccard distance matrix and (D) unweighted UniFrac distance. The dissimilarity was analyzed using Adonis tests with 999 permutations. R^2 value (effect size) which means the percentage of the variation explained by the grouping, as well as P value to determine the statistical significance were shown in the figures. Global composition of the mycobiota at the (E) phylum and (F) genus levels among four study groups. Only the top 10 taxa were presented in the graph. HS, healthy subjects; Naive TB, naive TB patients; TB2MT, TB patients after 2 months of treatment; TB6MT, TB patients after 6 months of treatment. (Wilcoxon Rank Sum test, *, P < 0.05).
