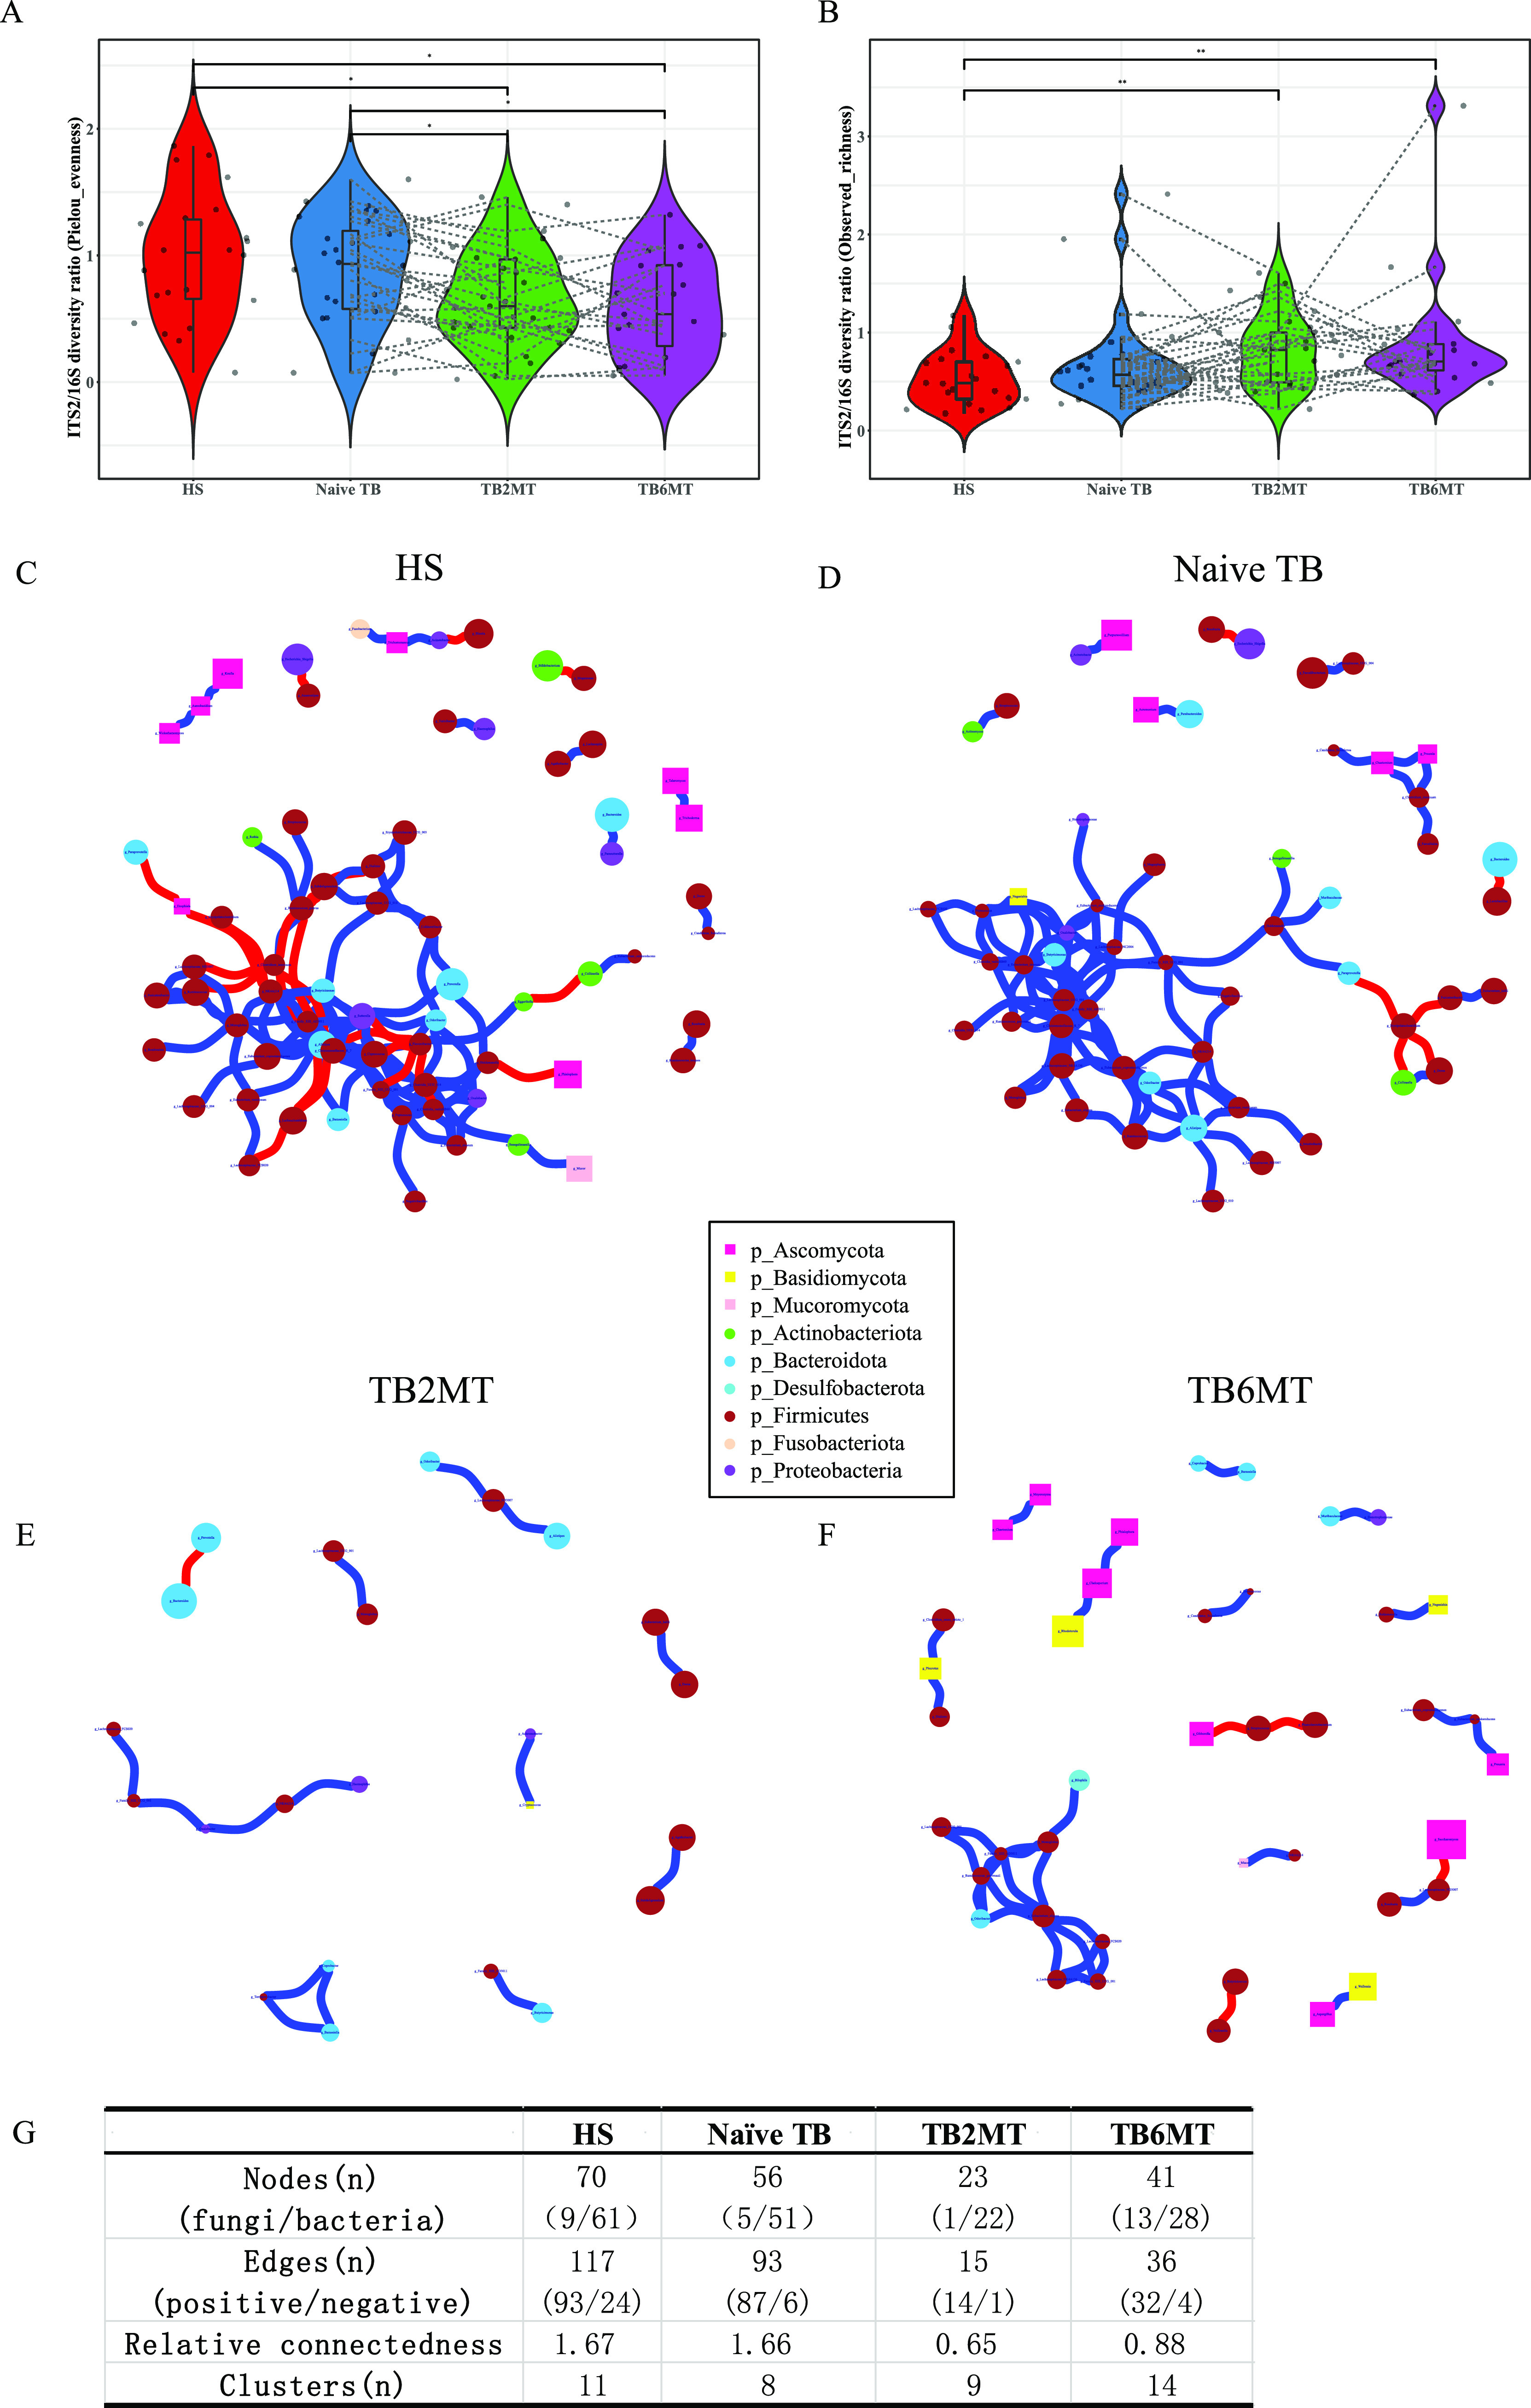
FIG 4.

Fungal-bacterial equilibration analyses in the four study groups. The ITS2/16S diversity ratio was calculated by the Pielou evenness at the (A) order level and by observed richness at the (B) genus level (Wilcoxon Rank Sum test, *, P < 0.05; **, P < 0.01). Transkingdom abundance correlation networks of (C) HS, (D) naive TB, (E) TB2MT, and (F) TB6MT groups at the genus level are shown using the R package igraph. Each node represents a genus, and its color represents the phylum to which it belongs. The shape of the nodes represents the kingdom to which they belong. Squares represent fungi and circles represent bacteria. Node size represents the mean abundance of each genus. Edges indicate the magnitude of correlations (positive in blue and negative in red). Only genera presented in >30% of the samples in at least one group were considered, and only significant correlations with P ≤ 0.10 after false discovery rate correction and (|r| ≥0.6 are displayed). (G) The parameters of the networks of each group. The relative connectedness of the network was calculated as the ratio of edges (the number of significant interactions) and nodes (the number of genera). HS, healthy subjects; Naive TB, naive TB patients; TB2MT, TB patients after 2 months of treatment; TB6MT, TB patients after 6 months of treatment. (Wilcoxon Rank Sum test, *, P < 0.05; **, P < 0.01).
