FIG 2.
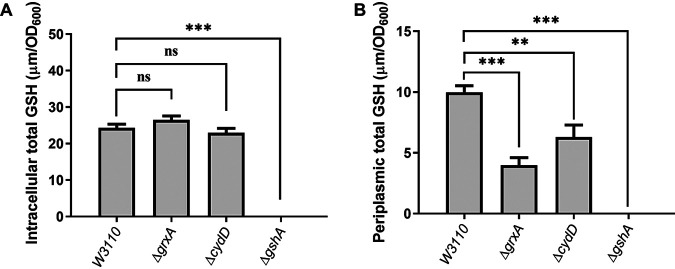
GSH content in E. coli W3110, ΔgrxA, ΔcydD, and ΔgshA. (A) Intracellular concentrations of total GSH. (B) Concentrations of total GSH in the periplasm. DTNB [5,5′-dithiobis-(2-nitrobenzoic acid)] assays were used to quantify GSH levels, which were normalized by the optical density at 600 nm (OD600). The data represent the mean ± standard deviation (SD) from three independent experiments. P values were calculated using t tests (**, P < 0.01; ***, P < 0.001; ns, not significant).

