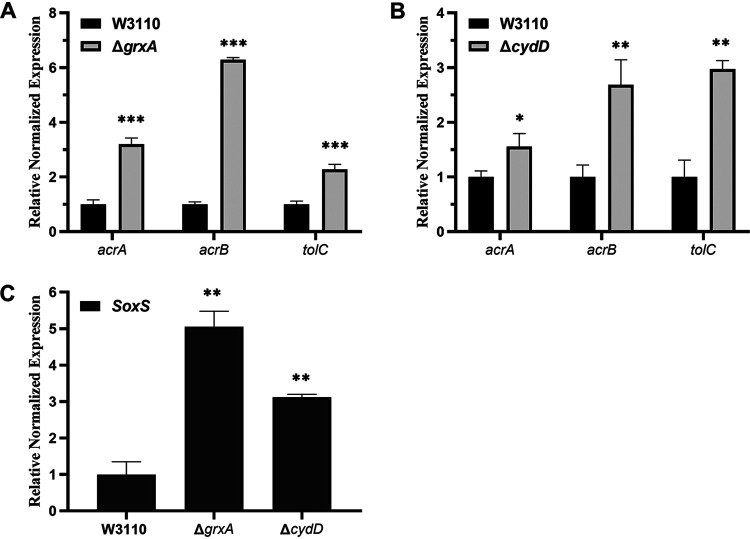
FIG 3.
Relative expression levels of acrAB, tolC, and soxS via RT-qPCR. (A) Expression levels of acrAB and tolC in E. coli W3110 and ΔgrxA. (B) Expression levels of acrAB and tolC in E. coli W3110 and ΔcydD. (C) Expression levels of soxS in E. coli W3110, ΔgrxA, and ΔcydD. The resulting cycle threshold (CT) values were normalized using gapA as the reference gene. The data represent the mean ± SD from three independent experiments. P values were calculated using t tests (*, P < 0.05; **, P < 0.01; ***, P < 0.001).

