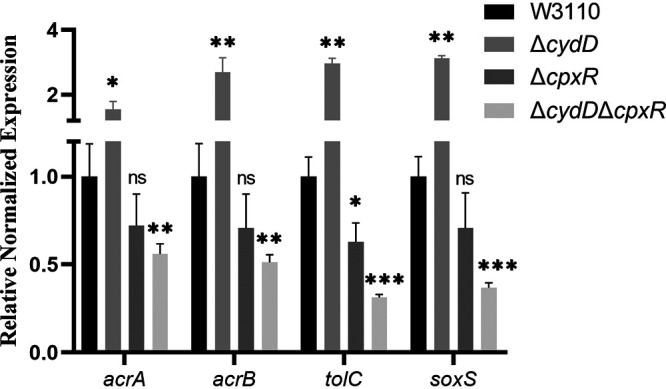
FIG 4.

Relative expression levels of acrAB, tolC, and SoxS in E. coli ΔcpxR and ΔcydDΔcpxR via RT-qPCR. The resulting CT values were normalized using gapA as the reference gene. The data represent the mean ± SD from three independent experiments. P values were calculated using t tests (*, P < 0.05; **, P < 0.01; ***, P < 0.001; ns, not significant).
