FIG 2.

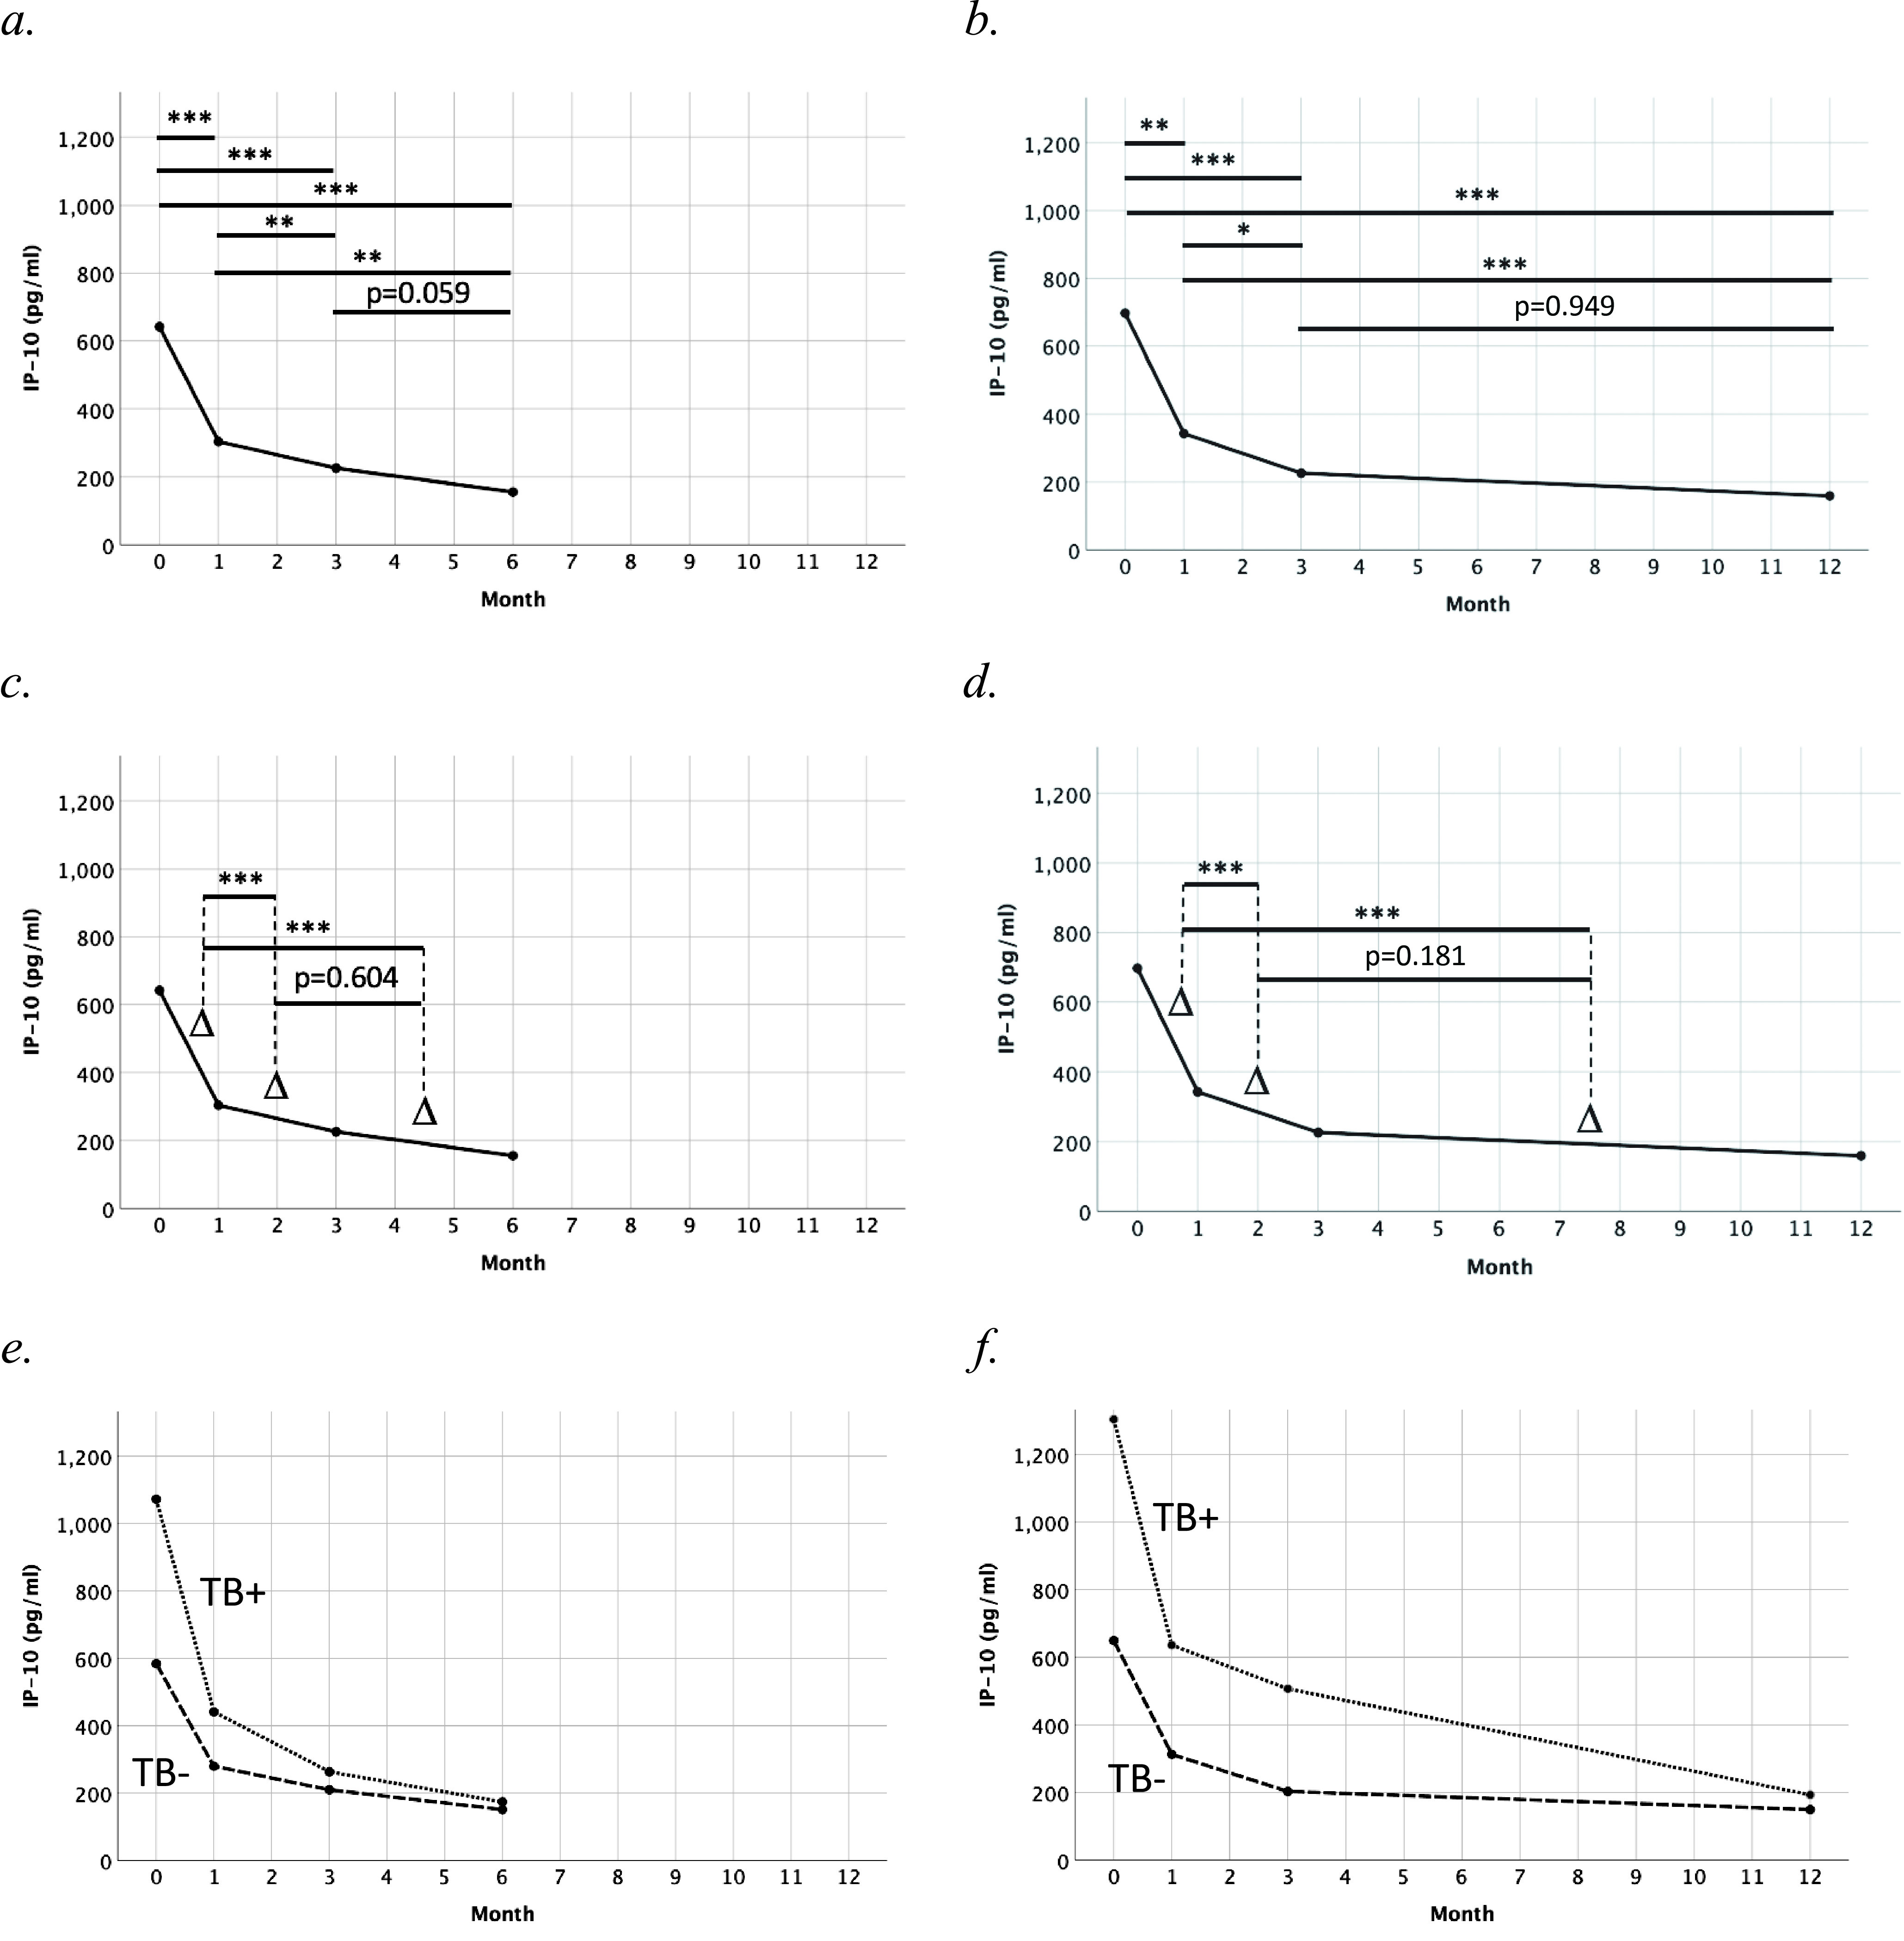
IP-10 kinetics during the initial 6–12 months of antiretroviral treatment in (a,c) VRs with IP-10 data available at B, M1, M3 and M6 (n = 60), (e) with (n = 12; dotted line) and without (n = 48; dash line) concomitant TB at baseline, and (b,d) VRs with IP-10 data available at B, M1, M3 and M12 (n = 41), (f) with (n = 9; dotted line) and without (n = 32; dash line) concomitant TB at baseline. Delta signs (Δ) represent IP-10 decline per month between two adjacent time points. P values correspond to pairwise comparisons from related-samples Friedman’s two-way ANOVA by ranks, adjusted by Bonferroni correction for multiple tests. IP-10, interferon-γ-inducible protein 10. *, P < 0.05; **, P < 0.01; ***, P < 0.001.
